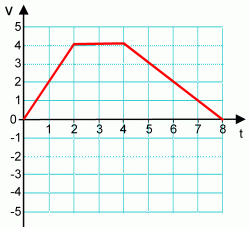
Consider the v-t graph below. When, if ever, does the object turn around?
- 0 s
- 1 s
- 2 s
- 3 s
- 4 s
- 5 s
- 6 s
- 7 s
- 8 s
- Never
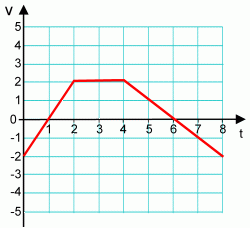
Consider the v-t graph below. When, if ever, does the object turn around?
- 0 s
- 1 s
- 2 s
- 3 s
- 4 s
- 5 s
- 6 s
- 7 s
- 8 s
- Never
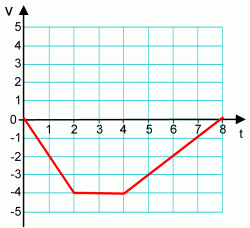
Consider the v-t graph below. When, if ever, does the object turn around?
- 0 s
- 1 s
- 2 s
- 3 s
- 4 s
- 5 s
- 6 s
- 7 s
- 8 s
- Never
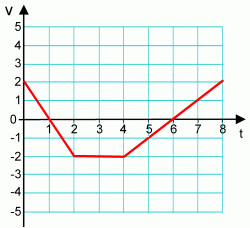
Consider the v-t graph below. When, if ever, does the object turn around?
- 0 s
- 1 s
- 2 s
- 3 s
- 4 s
- 5 s
- 6 s
- 7 s
- 8 s
- Never
Consider the v-t graph below. When, if ever, does the object turn around?
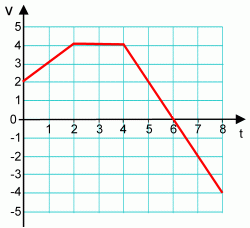
- 0 s
- 1 s
- 2 s
- 3 s
- 4 s
- 5 s
- 6 s
- 7 s
- 8 s
- Never
Consider the v-t graph below. When, if ever, does the object turn around?
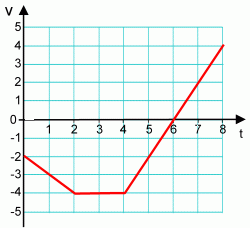
- 0 s
- 1 s
- 2 s
- 3 s
- 4 s
- 5 s
- 6 s
- 7 s
- 8 s
- Never
Consider the v-t graph below. When, if ever, does the object turn around?
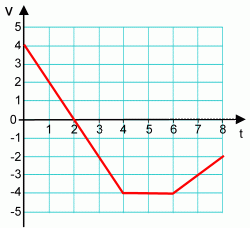
- 0 s
- 1 s
- 2 s
- 3 s
- 4 s
- 5 s
- 6 s
- 7 s
- 8 s
- Never
Consider the v-t graph below. When, if ever, does the object turn around?
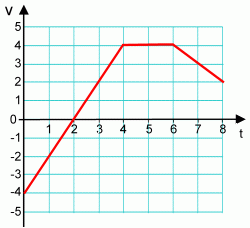
- 0 s
- 1 s
- 2 s
- 3 s
- 4 s
- 5 s
- 6 s
- 7 s
- 8 s
- Never
Consider the v-t graph below. When, if ever, does the object turn around?
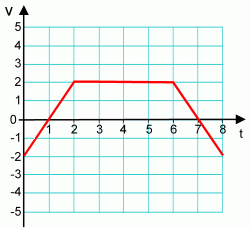
- 0 s
- 1 s
- 2 s
- 3 s
- 4 s
- 5 s
- 6 s
- 7 s
- 8 s
- Never
Consider the v-t graph below. When, if ever, does the object turn around?
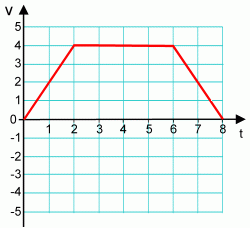
- 0 s
- 1 s
- 2 s
- 3 s
- 4 s
- 5 s
- 6 s
- 7 s
- 8 s
- Never
Consider the v-t graph below. When, if ever, does the object turn around?
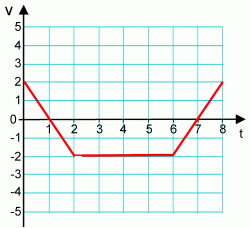
- 0 s
- 1 s
- 2 s
- 3 s
- 4 s
- 5 s
- 6 s
- 7 s
- 8 s
- Never
Consider the v-t graph below. When, if ever, does the object turn around?
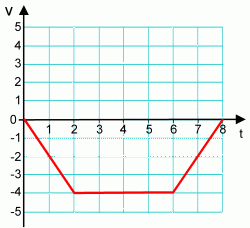
- 0 s
- 1 s
- 2 s
- 3 s
- 4 s
- 5 s
- 6 s
- 7 s
- 8 s
- Never
Consider the v-t graph below. When, if ever, does the object turn around?
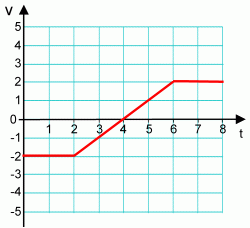
- 0 s
- 1 s
- 2 s
- 3 s
- 4 s
- 5 s
- 6 s
- 7 s
- 8 s
- Never
Consider the v-t graph below. When, if ever, does the object turn around?
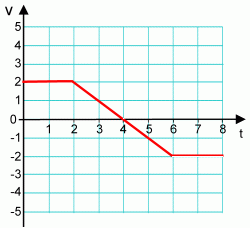
- 0 s
- 1 s
- 2 s
- 3 s
- 4 s
- 5 s
- 6 s
- 7 s
- 8 s
- Never
Consider the v-t graph below. When, if ever, does the object turn around?
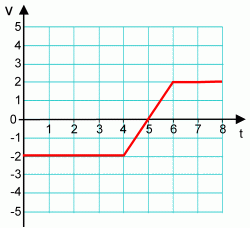
- 0 s
- 1 s
- 2 s
- 3 s
- 4 s
- 5 s
- 6 s
- 7 s
- 8 s
- Never
Consider the v-t graph below. When, if ever, does the object turn around?
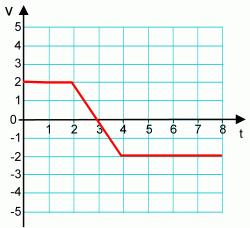
- 0 s
- 1 s
- 2 s
- 3 s
- 4 s
- 5 s
- 6 s
- 7 s
- 8 s
- Never
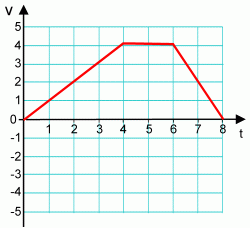
Consider the v-t graph below. When, if ever, does the object turn around?
- 0 s
- 1 s
- 2 s
- 3 s
- 4 s
- 5 s
- 6 s
- 7 s
- 8 s
- Never
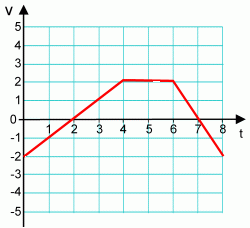
Consider the v-t graph below. When, if ever, does the object turn around?
- 0 s
- 1 s
- 2 s
- 3 s
- 4 s
- 5 s
- 6 s
- 7 s
- 8 s
- Never
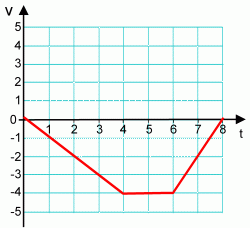
Consider the v-t graph below. When, if ever, does the object turn around?
- 1 s
- 2 s
- 3 s
- 4 s
- 5 s
- 6 s
- 7 s
- 8 s
- Never
- 0 s
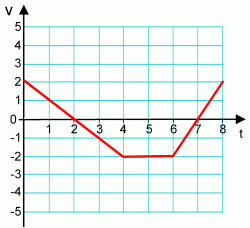
Consider the v-t graph below. When, if ever, does the object turn around?
- 0 s
- 1 s
- 2 s
- 3 s
- 4 s
- 5 s
- 6 s
- 7 s
- 8 s
- Never
Consider the v-t graph below. What is the earliest time, if ever, that the object is the farthest in the positive direction from its starting point?
- 0 s
- 1 s
- 2 s
- 3 s
- 4 s
- 5 s
- 6 s
- 7 s
- 8 s
- Never
Consider the v-t graph below. What is the earliest time, if ever, that the object is the farthest in the positive direction from its starting point?
- 0 s
- 1 s
- 2 s
- 3 s
- 4 s
- 5 s
- 6 s
- 7 s
- 8 s
- Never
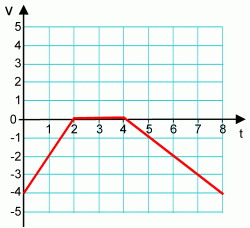
Consider the v-t graph below. What is the earliest time, if ever, that the object is the farthest in the positive direction from its starting point?
- 0 s
- 1 s
- 2 s
- 3 s
- 4 s
- 5 s
- 6 s
- 7 s
- 8 s
Consider the v-t graph below. What is the earliest time, if ever, that the object is the farthest in the positive direction from its starting point?
- 0 s
- 1 s
- 2 s
- 3 s
- 4 s
- 5 s
- 6 s
- 7 s
- 8 s
- Never
Consider the v-t graph below. What is the earliest time, if ever, that the object is the farthest in the positive direction from its starting point?
- 0 s
- 1 s
- 2 s
- 3 s
- 4 s
- 5 s
- 6 s
- 7 s
- 8 s
- Never
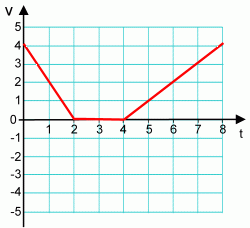
Consider the v-t graph below. What is the earliest time, if ever, that the object is the farthest in the positive direction from its starting point?
- 0 s
- 1 s
- 2 s
- 3 s
- 4 s
- 5 s
- 6 s
- 7 s
- 8 s
- Never
Consider the v-t graph below. What is the earliest time, if ever, that the object is the farthest in the positive direction from its starting point?
- 0 s
- 1 s
- 2 s
- 3 s
- 4 s
- 5 s
- 6 s
- 7 s
- 8 s
- Never
Consider the v-t graph below. What is the earliest time, if ever, that the object is the farthest in the positive direction from its starting point?
- 0 s
- 1 s
- 2 s
- 3 s
- 4 s
- 5 s
- 6 s
- 7 s
- 8 s
- Never
Consider the v-t graph below. What is the earliest time, if ever, that the object is the farthest in the positive direction from its starting point?
- 0 s
- 1 s
- 2 s
- 3 s
- 4 s
- 5 s
- 6 s
- 7 s
- 8 s
- Never
Consider the v-t graph below. What is the earliest time, if ever, that the object is the farthest in the positive direction from its starting point?
- 0 s
- 1 s
- 2 s
- 3 s
- 4 s
- 5 s
- 6 s
- 7 s
- 8 s
- Never
Consider the v-t graph below. What is the earliest time, if ever, that the object is the farthest in the positive direction from its starting point?
- 0 s
- 1 s
- 2 s
- 3 s
- 4 s
- 5 s
- 6 s
- 7 s
- 8 s
- Never
Consider the v-t graph below. What is the earliest time, if ever, that the object is the farthest in the positive direction from its starting point?
- 0 s
- 1 s
- 2 s
- 3 s
- 4 s
- 5 s
- 6 s
- 7 s
- 8 s
- Never
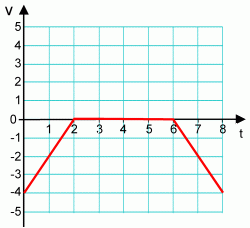
Consider the v-t graph below. What is the earliest time, if ever, that the object is the farthest in the positive direction from its starting point?
- 0 s
- 1 s
- 2 s
- 3 s
- 4 s
- 5 s
- 6 s
- 7 s
- 8 s
- Never
Consider the v-t graph below. What is the earliest time, if ever, that the object is the farthest in the positive direction from its starting point?
- 0 s
- 1 s
- 2 s
- 3 s
- 4 s
- 5 s
- 6 s
- 7 s
- 8 s
- Never
Consider the v-t graph below. What is the earliest time, if ever, that the object is the farthest in the positive direction from its starting point?
- 0 s
- 1 s
- 2 s
- 3 s
- 4 s
- 5 s
- 6 s
- 7 s
- 8 s
- Never
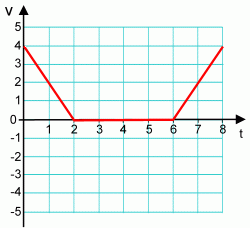
Consider the v-t graph below. What is the earliest time, if ever, that the object is the farthest in the positive direction from its starting point?
- 0 s
- 1 s
- 2 s
- 3 s
- 4 s
- 5 s
- 6 s
- 7 s
- 8 s
- Never
Consider the v-t graph below. What is the earliest time, if ever, that the object is the farthest in the positive direction from its starting point?
- 0 s
- 1 s
- 2 s
- 3 s
- 4 s
- 5 s
- 6 s
- 7 s
- 8 s
- Never
Consider the v-t graph below. What is the earliest time, if ever, that the object is the farthest in the positive direction from its starting point?
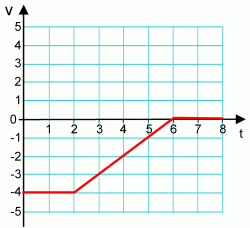
- 0 s
- 1 s
- 2 s
- 3 s
- 4 s
- 5 s
- 6 s
- 7 s
- 8 s
- Never
Consider the v-t graph below. What is the earliest time, if ever, that the object is the farthest in the positive direction from its starting point?
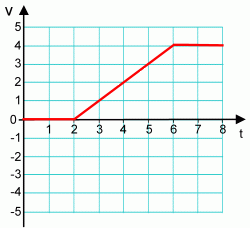
- 0 s
- 1 s
- 2 s
- 3 s
- 4 s
- 5 s
- 6 s
- 7 s
- 8 s
- Never
Consider the v-t graph below. What is the earliest time, if ever, that the object is the farthest in the positive direction from its starting point?
- 0 s
- 1 s
- 2 s
- 3 s
- 4 s
- 5 s
- 6 s
- 7 s
- 8 s
- Never
Consider the v-t graph below. What is the earliest time, if ever, that the object is the farthest in the positive direction from its starting point?
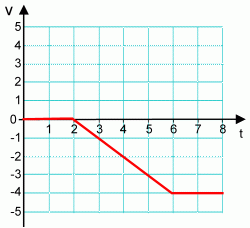
- 0 s
- 1 s
- 2 s
- 3 s
- 4 s
- 5 s
- 6 s
- 7 s
- 8 s
- Never
Consider the v-t graph below. What is the earliest time, if ever, that the object is the farthest in the positive direction from its starting point?
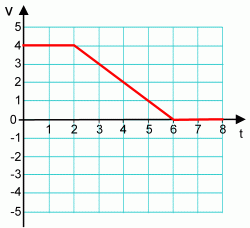
- 0 s
- 1 s
- 2 s
- 3 s
- 4 s
- 5 s
- 6 s
- 7 s
- 8 s
- Never
Consider the v-t graph below. What is the earliest time, if ever, that the object is the farthest in the positive direction from its starting point?
- 0 s
- 1 s
- 2 s
- 3 s
- 4 s
- 5 s
- 6 s
- 7 s
- 8 s
- Never
Consider the v-t graph below. What is the earliest time, if ever, that the object is the farthest in the positive direction from its starting point?
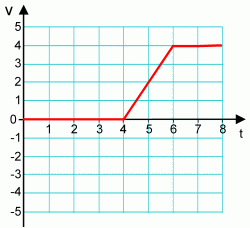
- 0 s
- 1 s
- 2 s
- 3 s
- 4 s
- 5 s
- 6 s
- 7 s
- 8 s
- Never
Consider the v-t graph below. What is the earliest time, if ever, that the object is the farthest in the positive direction from its starting point?
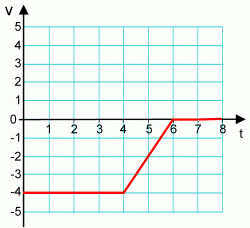
- 0 s
- 1 s
- 2 s
- 3 s
- 4 s
- 5 s
- 6 s
- 7 s
- 8 s
- Never
Consider the v-t graph below. What is the earliest time, if ever, that the object is the farthest in the positive direction from its starting point?
- 0 s
- 1 s
- 2 s
- 3 s
- 4 s
- 5 s
- 6 s
- 7 s
- 8 s
- Never
Consider the v-t graph below. What is the earliest time, if ever, that the object is the farthest in the positive direction from its starting point?
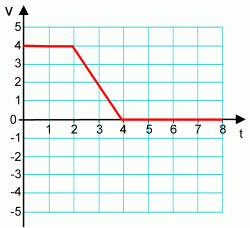
- 0 s
- 1 s
- 2 s
- 3 s
- 4 s
- 5 s
- 6 s
- 7 s
- 8 s
- Never
Consider the v-t graph below. What is the earliest time, if ever, that the object is the farthest in the positive direction from its starting point?
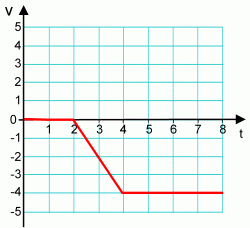
- 0 s
- 1 s
- 2 s
- 3 s
- 4 s
- 5 s
- 6 s
- 7 s
- 8 s
- Never
Consider the v-t graph below. What is the earliest time, if ever, that the object is the farthest in the positive direction from its starting point?
- 0 s
- 1 s
- 2 s
- 3 s
- 4 s
- 5 s
- 6 s
- 7 s
- 8 s
- Never
Consider the v-t graph below. What is the earliest time, if ever, that the object is the farthest in the positive direction from its starting point?
- 0 s
- 1 s
- 2 s
- 3 s
- 4 s
- 5 s
- 6 s
- 7 s
- 8 s
- Never
Consider the v-t graph below. What is the earliest time, if ever, that the object is the farthest in the positive direction from its starting point?
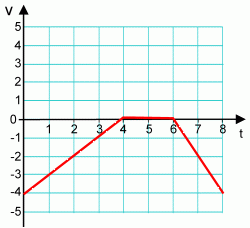
- 0 s
- 1 s
- 2 s
- 3 s
- 4 s
- 5 s
- 6 s
- 7 s
- 8 s
- Never
Consider the v-t graph below. What is the earliest time, if ever, that the object is the farthest in the positive direction from its starting point?
- 0 s
- 1 s
- 2 s
- 3 s
- 4 s
- 5 s
- 6 s
- 7 s
- 8 s
- Never
Consider the v-t graph below. What is the earliest time, if ever, that the object is the farthest in the positive direction from its starting point?
- 0 s
- 1 s
- 2 s
- 3 s
- 4 s
- 5 s
- 6 s
- 7 s
- 8 s
- Never
Consider the v-t graph below. What is the earliest time, if ever, that the object is the farthest in the positive direction from its starting point?
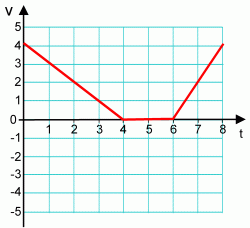
- 0 s
- 1 s
- 2 s
- 3 s
- 4 s
- 5 s
- 6 s
- 7 s
- 8 s
- Never
Consider the v-t graph below. What is the earliest time, if ever, that the object is the farthest in the negative direction from its starting point?
- 0 s
- 1 s
- 2 s
- 3 s
- 4 s
- 5 s
- 6 s
- 7 s
- 8 s
- Never
Consider the v-t graph below. What is the earliest time, if ever, that the object is the farthest in the negative direction from its starting point?
- 0 s
- 1 s
- 2 s
- 3 s
- 4 s
- 5 s
- 6 s
- 7 s
- 8 s
- Never
Consider the v-t graph below. What is the earliest time, if ever, that the object is the farthest in the negative direction from its starting point?
- 0 s
- 1 s
- 2 s
- 3 s
- 4 s
- 5 s
- 6 s
- 7 s
- 8 s
- Never
Consider the v-t graph below. What is the earliest time, if ever, that the object is the farthest in the negative direction from its starting point?
- 0 s
- 1 s
- 2 s
- 3 s
- 4 s
- 5 s
- 6 s
- 7 s
- 8 s
- Never
Consider the v-t graph below. What is the earliest time, if ever, that the object is the farthest in the negative direction from its starting point?
- 0 s
- 1 s
- 2 s
- 3 s
- 4 s
- 5 s
- 6 s
- 7 s
- 8 s
- Never
Consider the v-t graph below. What is the earliest time, if ever, that the object is the farthest in the negative direction from its starting point?
- 0 s
- 1 s
- 2 s
- 3 s
- 4 s
- 5 s
- 6 s
- 7 s
- 8 s
- Never
Consider the v-t graph below. What is the earliest time, if ever, that the object is the farthest in the negative direction from its starting point?
- 0 s
- 1 s
- 2 s
- 3 s
- 4 s
- 5 s
- 6 s
- 7 s
- 8 s
- Never
Consider the v-t graph below. What is the earliest time, if ever, that the object is the farthest in the negative direction from its starting point?
- 0 s
- 1 s
- 2 s
- 3 s
- 4 s
- 5 s
- 6 s
- 7 s
- 8 s
- Never
Consider the v-t graph below. What is the earliest time, if ever, that the object is the farthest in the negative direction from its starting point?
- 0 s
- 1 s
- 2 s
- 3 s
- 4 s
- 5 s
- 6 s
- 7 s
- 8 s
- Never
Consider the v-t graph below. What is the earliest time, if ever, that the object is the farthest in the negative direction from its starting point?
- 0 s
- 1 s
- 2 s
- 3 s
- 4 s
- 5 s
- 6 s
- 7 s
- 8 s
- Never
Consider the v-t graph below. What is the earliest time, if ever, that the object is the farthest in the negative direction from its starting point?
- 0 s
- 1 s
- 2 s
- 3 s
- 4 s
- 5 s
- 6 s
- 7 s
- 8 s
- Never
Consider the v-t graph below. What is the earliest time, if ever, that the object is the farthest in the negative direction from its starting point?
- 0 s
- 1 s
- 2 s
- 3 s
- 4 s
- 5 s
- 6 s
- 7 s
- 8 s
- Never
Consider the v-t graph below. What is the earliest time, if ever, that the object is the farthest in the negative direction from its starting point?
- 0 s
- 1 s
- 2 s
- 3 s
- 4 s
- 5 s
- 6 s
- 7 s
- 8 s
- Never
Consider the v-t graph below. What is the earliest time, if ever, that the object is the farthest in the negative direction from its starting point?
- 0 s
- 1 s
- 2 s
- 3 s
- 4 s
- 5 s
- 6 s
- 7 s
- 8 s
- Never
Consider the v-t graph below. What is the earliest time, if ever, that the object is the farthest in the negative direction from its starting point?
- 0 s
- 1 s
- 2 s
- 3 s
- 4 s
- 5 s
- 6 s
- 7 s
- 8 s
- Never
Consider the v-t graph below. What is the earliest time, if ever, that the object is the farthest in the negative direction from its starting point?
- 0 s
- 1 s
- 2 s
- 3 s
- 4 s
- 5 s
- 6 s
- 7 s
- 8 s
- Never
Consider the v-t graph below. What is the earliest time, if ever, that the object is the farthest in the negative direction from its starting point?
- 0 s
- 1 s
- 2 s
- 3 s
- 4 s
- 5 s
- 6 s
- 7 s
- 8 s
- Never
Consider the v-t graph below. What is the earliest time, if ever, that the object is the farthest in the negative direction from its starting point?
- 0 s
- 1 s
- 2 s
- 3 s
- 4 s
- 5 s
- 6 s
- 7 s
- 8 s
- Never
Consider the v-t graph below. What is the earliest time, if ever, that the object is the farthest in the negative direction from its starting point?
- 0 s
- 1 s
- 2 s
- 3 s
- 4 s
- 5 s
- 6 s
- 7 s
- 8 s
- Never
Consider the v-t graph below. What is the earliest time, if ever, that the object is the farthest in the negative direction from its starting point?
- 0 s
- 1 s
- 2 s
- 3 s
- 4 s
- 5 s
- 6 s
- 7 s
- 8 s
- Never
Consider the v-t graph below. What is the earliest time, if ever, that the object is the farthest in the negative direction from its starting point?
- 0 s
- 1 s
- 2 s
- 3 s
- 4 s
- 5 s
- 6 s
- 7 s
- 8 s
- Never
Consider the v-t graph below. What is the earliest time, if ever, that the object is the farthest in the negative direction from its starting point?
- 0 s
- 1 s
- 2 s
- 3 s
- 4 s
- 5 s
- 6 s
- 7 s
- 8 s
- Never
Consider the v-t graph below. What is the earliest time, if ever, that the object is the farthest in the negative direction from its starting point?
- 0 s
- 1 s
- 2 s
- 3 s
- 4 s
- 5 s
- 6 s
- 7 s
- 8 s
- Never
Consider the v-t graph below. What is the earliest time, if ever, that the object is the farthest in the negative direction from its starting point?
- 0 s
- 1 s
- 2 s
- 3 s
- 4 s
- 5 s
- 6 s
- 7 s
- 8 s
- Never
Consider the v-t graph below. What is the earliest time, if ever, that the object is the farthest in the negative direction from its starting point?
- 0 s
- 1 s
- 2 s
- 3 s
- 4 s
- 5 s
- 6 s
- 7 s
- 8 s
- Never
Consider the v-t graph below. What is the earliest time, if ever, that the object is the farthest in the negative direction from its starting point?
- 0 s
- 1 s
- 2 s
- 3 s
- 4 s
- 5 s
- 6 s
- 7 s
- 8 s
- Never
Consider the v-t graph below. What is the earliest time, if ever, that the object is the farthest in the negative direction from its starting point?
- 0 s
- 1 s
- 2 s
- 3 s
- 4 s
- 5 s
- 6 s
- 7 s
- 8 s
- Never
Consider the v-t graph below. What is the earliest time, if ever, that the object is the farthest in the negative direction from its starting point?
- 0 s
- 1 s
- 2 s
- 3 s
- 4 s
- 5 s
- 6 s
- 7 s
- 8 s
- Never
Consider the v-t graph below. What is the earliest time, if ever, that the object is the farthest in the negative direction from its starting point?
- 0 s
- 1 s
- 2 s
- 3 s
- 4 s
- 5 s
- 6 s
- 7 s
- 8 s
- Never
Consider the v-t graph below. What is the earliest time, if ever, that the object is the farthest in the negative direction from its starting point?
- 0 s
- 1 s
- 2 s
- 3 s
- 4 s
- 5 s
- 6 s
- 7 s
- 8 s
- Never
Consider the v-t graph below. What is the earliest time, if ever, that the object is the farthest in the negative direction from its starting point?
- 0 s
- 1 s
- 2 s
- 3 s
- 4 s
- 5 s
- 6 s
- 7 s
- 8 s
- Never
Consider the v-t graph below. What is the earliest time, if ever, that the object is the farthest in the negative direction from its starting point?
- 0 s
- 1 s
- 2 s
- 3 s
- 4 s
- 5 s
- 6 s
- 7 s
- 8 s
- Never
Consider the v-t graph below. What is the earliest time, if ever, that the object is the farthest in the negative direction from its starting point?
- 0 s
- 1 s
- 2 s
- 3 s
- 4 s
- 5 s
- 6 s
- 7 s
- 8 s
- Never
Consider the v-t graph below. What is the earliest time, if ever, that the object is the farthest in the negative direction from its starting point?
- 0 s
- 1 s
- 2 s
- 3 s
- 4 s
- 5 s
- 6 s
- 7 s
- 8 s
- Never
Consider the v-t graph below. What is the latest time, if ever, that the object returns to its starting point?
- 0 s
- 1 s
- 2 s
- 3 s
- 4 s
- 5 s
- 6 s
- 7 s
- 8 s
- Never
Consider the v-t graph below. What is the latest time, if ever, that the object returns to its starting point?
- 0 s
- 1 s
- 2 s
- 3 s
- 4 s
- 5 s
- 6 s
- 7 s
- 8 s
- Never
Consider the v-t graph below. What is the latest time, if ever, that the object returns to its starting point?
- 0 s
- 1 s
- 2 s
- 3 s
- 4 s
- 5 s
- 6 s
- 7 s
- 8 s
- Never
Consider the v-t graph below. What is the latest time, if ever, that the object returns to its starting point?
- 0 s
- 1 s
- 2 s
- 3 s
- 4 s
- 5 s
- 6 s
- 7 s
- 8 s
- Never
Consider the v-t graph below. What is the latest time, if ever, that the object returns to its starting point?
- 0 s
- 1 s
- 2 s
- 3 s
- 4 s
- 5 s
- 6 s
- 7 s
- 8 s
- Never
Consider the v-t graph below. What is the latest time, if ever, that the object returns to its starting point?
- 0 s
- 1 s
- 2 s
- 3 s
- 4 s
- 5 s
- 6 s
- 7 s
- 8 s
- Never
Consider the v-t graph below. What is the latest time, if ever, that the object returns to its starting point?
- 0 s
- 1 s
- 2 s
- 3 s
- 4 s
- 5 s
- 6 s
- 7 s
- 8 s
- Never
Consider the v-t graph below. What is the latest time, if ever, that the object returns to its starting point?
- 0 s
- 1 s
- 2 s
- 3 s
- 4 s
- 5 s
- 6 s
- 7 s
- 8 s
- Never
Consider the v-t graph below. What is the latest time, if ever, that the object returns to its starting point?
- 0 s
- 1 s
- 2 s
- 3 s
- 4 s
- 5 s
- 6 s
- 7 s
- 8 s
- Never
Consider the v-t graph below. What is the latest time, if ever, that the object returns to its starting point?
- 0 s
- 1 s
- 2 s
- 3 s
- 4 s
- 5 s
- 6 s
- 7 s
- 8 s
- Never
Consider the v-t graph below. What is the latest time, if ever, that the object returns to its starting point?
- 0 s
- 1 s
- 2 s
- 3 s
- 4 s
- 5 s
- 6 s
- 7 s
- 8 s
- Never
Consider the v-t graph below. What is the latest time, if ever, that the object returns to its starting point?
- 0 s
- 1 s
- 2 s
- 3 s
- 4 s
- 5 s
- 6 s
- 7 s
- 8 s
- Never
Consider the v-t graph below. What is the latest time, if ever, that the object returns to its starting point?
- 0 s
- 1 s
- 2 s
- 3 s
- 4 s
- 5 s
- 6 s
- 7 s
- 8 s
- Never
Consider the v-t graph below. What is the latest time, if ever, that the object returns to its starting point?
- 0 s
- 1 s
- 2 s
- 3 s
- 4 s
- 5 s
- 6 s
- 7 s
- 8 s
- Never
Consider the v-t graph below. What is the latest time, if ever, that the object returns to its starting point?
- 0 s
- 1 s
- 2 s
- 3 s
- 4 s
- 5 s
- 6 s
- 7 s
- 8 s
- Never
Consider the v-t graph below. What is the latest time, if ever, that the object returns to its starting point?
- 0 s
- 1 s
- 2 s
- 3 s
- 4 s
- 5 s
- 6 s
- 7 s
- 8 s
- Never
Consider the v-t graph below. What is the latest time, if ever, that the object returns to its starting point?
- 0 s
- 1 s
- 2 s
- 3 s
- 4 s
- 5 s
- 6 s
- 7 s
- 8 s
- Never
Consider the v-t graph below. What is the latest time, if ever, that the object returns to its starting point?
- 0 s
- 1 s
- 2 s
- 3 s
- 4 s
- 5 s
- 6 s
- 7 s
- 8 s
- Never
Consider the v-t graph below. What is the latest time, if ever, that the object returns to its starting point?
- 0 s
- 1 s
- 2 s
- 3 s
- 4 s
- 5 s
- 6 s
- 7 s
- 8 s
- Never
Consider the v-t graph below. What is the latest time, if ever, that the object returns to its starting point?
- 0 s
- 1 s
- 2 s
- 3 s
- 4 s
- 5 s
- 6 s
- 7 s
- 8 s
- Never
Consider the v-t graph below. What is the latest time, if ever, that the object returns to its starting point?
- 0 s
- 1 s
- 2 s
- 3 s
- 4 s
- 5 s
- 6 s
- 7 s
- 8 s
- Never
Consider the v-t graph below. What is the latest time, if ever, that the object returns to its starting point?
- 0 s
- 1 s
- 2 s
- 3 s
- 4 s
- 5 s
- 6 s
- 7 s
- 8 s
- Never
Consider the v-t graph below. What is the latest time, if ever, that the object returns to its starting point?
- 0 s
- 1 s
- 2 s
- 3 s
- 4 s
- 5 s
- 6 s
- 7 s
- 8 s
- Never
Consider the v-t graph below. What is the latest time, if ever, that the object returns to its starting point?
- 0 s
- 1 s
- 2 s
- 3 s
- 4 s
- 5 s
- 6 s
- 7 s
- 8 s
- Never
Consider the v-t graph below. What is the latest time, if ever, that the object returns to its starting point?
- 0 s
- 1 s
- 2 s
- 3 s
- 4 s
- 5 s
- 6 s
- 7 s
- 8 s
- Never
Consider the v-t graph below. What is the latest time, if ever, that the object returns to its starting point?
- 0 s
- 1 s
- 2 s
- 3 s
- 4 s
- 5 s
- 6 s
- 7 s
- 8 s
- Never
Consider the v-t graph below. What is the latest time, if ever, that the object returns to its starting point?
- 0 s
- 1 s
- 2 s
- 3 s
- 4 s
- 5 s
- 6 s
- 7 s
- 8 s
- Never
Consider the v-t graph below. What is the latest time, if ever, that the object returns to its starting point?
- 0 s
- 1 s
- 2 s
- 3 s
- 4 s
- 5 s
- 6 s
- 7 s
- 8 s
- Never
Consider the v-t graph below. What is the latest time, if ever, that the object returns to its starting point?
- 0 s
- 1 s
- 2 s
- 3 s
- 4 s
- 5 s
- 6 s
- 7 s
- 8 s
- Never
Consider the v-t graph below. What is the latest time, if ever, that the object returns to its starting point?
- 0 s
- 1 s
- 2 s
- 3 s
- 4 s
- 5 s
- 6 s
- 7 s
- 8 s
- Never
Consider the v-t graph below. What is the latest time, if ever, that the object returns to its starting point?
- 0 s
- 1 s
- 2 s
- 3 s
- 4 s
- 5 s
- 6 s
- 7 s
- 8 s
- Never
Consider the v-t graph below. What is the latest time, if ever, that the object returns to its starting point?
- 0 s
- 1 s
- 2 s
- 3 s
- 4 s
- 5 s
- 6 s
- 7 s
- 8 s
- Never
Consider the v-t graph below. What is the latest time, if ever, that the object returns to its starting point?
- 0 s
- 1 s
- 2 s
- 3 s
- 4 s
- 5 s
- 6 s
- 7 s
- 8 s
- Never
Consider the v-t graph below. What is the latest time, if ever, that the object returns to its starting point?
- 0 s
- 1 s
- 2 s
- 3 s
- 4 s
- 5 s
- 6 s
- 7 s
- 8 s
- Never
Consider the v-t graph below. What is the displacement during the time interval from t = 0 s to t = 2 s?
- 8 m
- 7 m
- 6 m
- 5 m
- 4 m
- 3 m
- 2 m
- 1 m
- 0 m
- -1 m
- -2 m
- -3 m
- -4 m
- -5 m
- -6 m
- -7 m
- -8 m
Consider the v-t graph below. What is the displacement during the time interval from t = 0 s to t = 2 s?
- 8 m
- 7 m
- 6 m
- 5 m
- 4 m
- 3 m
- 2 m
- 1 m
- 0 m
- -1 m
- -2 m
- -3 m
- -4 m
- -5 m
- -6 m
- -7 m
- -8 m
Consider the v-t graph below. What is the displacement during the time interval from t = 0 s to t = 2 s?
- 8 m
- 7 m
- 6 m
- 5 m
- 4 m
- 3 m
- 2 m
- 1 m
- 0 m
- -1 m
- -2 m
- -3 m
- -4 m
- -5 m
- -6 m
- -7 m
- -8 m
Consider the v-t graph below. What is the displacement during the time interval from t = 0 s to t = 2 s?
- 8 m
- 7 m
- 6 m
- 5 m
- 4 m
- 3 m
- 2 m
- 1 m
- 0 m
- -1 m
- -2 m
- -3 m
- -4 m
- -5 m
- -6 m
- -7 m
- -8 m
Consider the v-t graph below. What is the displacement during the time interval from t = 0 s to t = 2 s?
- 8 m
- 7 m
- 6 m
- 5 m
- 4 m
- 3 m
- 2 m
- 1 m
- 0 m
- -1 m
- -2 m
- -3 m
- -4 m
- -5 m
- -6 m
- -7 m
- -8 m
Consider the v-t graph below. What is the displacement during the time interval from t = 0 s to t = 2 s?
- 8 m
- 7 m
- 6 m
- 5 m
- 4 m
- 3 m
- 2 m
- 1 m
- 0 m
- -1 m
- -2 m
- -3 m
- -4 m
- -5 m
- -6 m
- -7 m
- -8 m
Consider the v-t graph below. What is the displacement during the time interval from t = 0 s to t = 2 s?
- 8 m
- 7 m
- 6 m
- 5 m
- 4 m
- 3 m
- 2 m
- 1 m
- 0 m
- -1 m
- -2 m
- -3 m
- -4 m
- -5 m
- -6 m
- -7 m
- -8 m
Consider the v-t graph below. What is the displacement during the time interval from t = 0 s to t = 2 s?
- 8 m
- 7 m
- 6 m
- 5 m
- 4 m
- 3 m
- 2 m
- 1 m
- 0 m
- -1 m
- -2 m
- -3 m
- -4 m
- -5 m
- -6 m
- -7 m
- -8 m
Consider the v-t graph below. What is the displacement during the time interval from t = 0 s to t = 4 s?
- 8 m
- 7 m
- 6 m
- 5 m
- 4 m
- 3 m
- 2 m
- 1 m
- 0 m
- -1 m
- -2 m
- -3 m
- -4 m
- -5 m
- -6 m
- -7 m
- -8 m
Consider the v-t graph below. What is the displacement during the time interval from t = 0 s to t = 4 s?
- 8 m
- 7 m
- 6 m
- 5 m
- 4 m
- 3 m
- 2 m
- 1 m
- 0 m
- -1 m
- -2 m
- -3 m
- -4 m
- -5 m
- -6 m
- -7 m
- -8 m
Consider the v-t graph below. What is the displacement during the time interval from t = 0 s to t = 2 s?
- 8 m
- 7 m
- 6 m
- 5 m
- 4 m
- 3 m
- 2 m
- 1 m
- 0 m
- -1 m
- -2 m
- -3 m
- -4 m
- -5 m
- -6 m
- -7 m
- -8 m
Consider the v-t graph below. What is the displacement during the time interval from t = 0 s to t = 2 s?
- 8 m
- 7 m
- 6 m
- 5 m
- 4 m
- 3 m
- 2 m
- 1 m
- 0 m
- -1 m
- -2 m
- -3 m
- -4 m
- -5 m
- -6 m
- -7 m
- -8 m
Consider the v-t graph below. What is the displacement during the time interval from t = 0 s to t = 2 s?
- 8 m
- 7 m
- 6 m
- 5 m
- 4 m
- 3 m
- 2 m
- 1 m
- 0 m
- -1 m
- -2 m
- -3 m
- -4 m
- -5 m
- -6 m
- -7 m
- -8 m
Consider the v-t graph below. What is the displacement during the time interval from t = 0 s to t = 2 s?
- 8 m
- 7 m
- 6 m
- 5 m
- 4 m
- 3 m
- 2 m
- 1 m
- 0 m
- -1 m
- -2 m
- -3 m
- -4 m
- -5 m
- -6 m
- -7 m
- -8 m
Consider the v-t graph below. What is the displacement during the time interval from t = 0 s to t = 2 s?
- 8 m
- 7 m
- 6 m
- 5 m
- 4 m
- 3 m
- 2 m
- 1 m
- 0 m
- -1 m
- -2 m
- -3 m
- -4 m
- -5 m
- -6 m
- -7 m
- -8 m
Consider the v-t graph below. What is the displacement during the time interval from t = 0 s to t = 2 s?
- 8 m
- 7 m
- 6 m
- 5 m
- 4 m
- 3 m
- 2 m
- 1 m
- 0 m
- -1 m
- -2 m
- -3 m
- -4 m
- -5 m
- -6 m
- -7 m
- -8 m
Consider the v-t graph below. What is the displacement during the time interval from t = 0 s to t = 2 s?
- 8 m
- 7 m
- 6 m
- 5 m
- 4 m
- 3 m
- 2 m
- 1 m
- 0 m
- -1 m
- -2 m
- -3 m
- -4 m
- -5 m
- -6 m
- -7 m
- -8 m
Consider the v-t graph below. What is the displacement during the time interval from t = 0 s to t = 2 s?
- 8 m
- 7 m
- 6 m
- 5 m
- 4 m
- 3 m
- 2 m
- 1 m
- 0 m
- -1 m
- -2 m
- -3 m
- -4 m
- -5 m
- -6 m
- -7 m
- -8 m
Consider the v-t graph below. What is the displacement during the time interval from t = 0 s to t = 2 s?
- 8 m
- 7 m
- 6 m
- 5 m
- 4 m
- 3 m
- 2 m
- 1 m
- 0 m
- -1 m
- -2 m
- -3 m
- -4 m
- -5 m
- -6 m
- -7 m
- -8 m
Consider the v-t graph below. What is the displacement during the time interval from t = 0 s to t = 2 s?
- 8 m
- 7 m
- 6 m
- 5 m
- 4 m
- 3 m
- 2 m
- 1 m
- 0 m
- -1 m
- -2 m
- -3 m
- -4 m
- -5 m
- -6 m
- -7 m
- -8 m
Consider the v-t graph below. What is the displacement during the time interval from t = 0 s to t = 2 s?
- 8 m
- 7 m
- 6 m
- 5 m
- 4 m
- 3 m
- 2 m
- 1 m
- 0 m
- -1 m
- -2 m
- -3 m
- -4 m
- -5 m
- -6 m
- -7 m
- -8 m
Consider the v-t graph below. What is the displacement during the time interval from t = 0 s to t = 2 s?
- 8 m
- 7 m
- 6 m
- 5 m
- 4 m
- 3 m
- 2 m
- 1 m
- 0 m
- -1 m
- -2 m
- -3 m
- -4 m
- -5 m
- -6 m
- -7 m
- -8 m
Consider the v-t graph below. What is the displacement during the time interval from t = 0 s to t = 4 s?
- 8 m
- 7 m
- 6 m
- 5 m
- 4 m
- 3 m
- 2 m
- 1 m
- 0 m
- -1 m
- -2 m
- -3 m
- -4 m
- -5 m
- -6 m
- -7 m
- -8 m
Consider the v-t graph below. What is the displacement during the time interval from t = 0 s to t = 4 s?
- 8 m
- 7 m
- 6 m
- 5 m
- 4 m
- 3 m
- 2 m
- 1 m
- 0 m
- -1 m
- -2 m
- -3 m
- -4 m
- -5 m
- -6 m
- -7 m
- -8 m
Consider the v-t graph below. What is the displacement during the time interval from t = 0 s to t = 2 s?
- 8 m
- 7 m
- 6 m
- 5 m
- 4 m
- 3 m
- 2 m
- 1 m
- 0 m
- -1 m
- -2 m
- -3 m
- -4 m
- -5 m
- -6 m
- -7 m
- -8 m
Consider the v-t graph below. What is the displacement during the time interval from t = 0 s to t = 2 s?
- 8 m
- 7 m
- 6 m
- 5 m
- 4 m
- 3 m
- 2 m
- 1 m
- 0 m
- -1 m
- -2 m
- -3 m
- -4 m
- -5 m
- -6 m
- -7 m
- -8 m
Consider the v-t graph below. What is the displacement during the time interval from t = 0 s to t = 4 s?
- 8 m
- 7 m
- 6 m
- 5 m
- 4 m
- 3 m
- 2 m
- 1 m
- 0 m
- -1 m
- -2 m
- -3 m
- -4 m
- -5 m
- -6 m
- -7 m
- -8 m
Consider the v-t graph below. What is the displacement during the time interval from t = 0 s to t = 4 s?
- 8 m
- 7 m
- 6 m
- 5 m
- 4 m
- 3 m
- 2 m
- 1 m
- 0 m
- -1 m
- -2 m
- -3 m
- -4 m
- -5 m
- -6 m
- -7 m
- -8 m
Consider the v-t graph below. What is the displacement during the time interval from t = 0 s to t = 4 s?
- 8 m
- 7 m
- 6 m
- 5 m
- 4 m
- 3 m
- 2 m
- 1 m
- 0 m
- -1 m
- -2 m
- -3 m
- -4 m
- -5 m
- -6 m
- -7 m
- -8 m
Consider the v-t graph below. What is the displacement during the time interval from t = 0 s to t = 4 s?
- 8 m
- 7 m
- 6 m
- 5 m
- 4 m
- 3 m
- 2 m
- 1 m
- 0 m
- -1 m
- -2 m
- -3 m
- -4 m
- -5 m
- -6 m
- -7 m
- -8 m
Consider the v-t graph below. What is the displacement during the time interval from t = 0 s to t = 4 s?
- 8 m
- 7 m
- 6 m
- 5 m
- 4 m
- 3 m
- 2 m
- 1 m
- 0 m
- -1 m
- -2 m
- -3 m
- -4 m
- -5 m
- -6 m
- -7 m
- -8 m
Consider the v-t graph below. What is the displacement during the time interval from t = 0 s to t = 4 s?
- 8 m
- 7 m
- 6 m
- 5 m
- 4 m
- 3 m
- 2 m
- 1 m
- 0 m
- -1 m
- -2 m
- -3 m
- -4 m
- -5 m
- -6 m
- -7 m
- -8 m
Consider the v-t graph below. What is the displacement during the time interval from t = 2 s to t = 4 s?
- 8 m
- 7 m
- 6 m
- 5 m
- 4 m
- 3 m
- 2 m
- 1 m
- 0 m
- -1 m
- -2 m
- -3 m
- -4 m
- -5 m
- -6 m
- -7 m
- -8 m
Consider the v-t graph below. What is the displacement during the time interval from t = 2 s to t = 4 s?
- 8 m
- 7 m
- 6 m
- 5 m
- 4 m
- 3 m
- 2 m
- 1 m
- 0 m
- -1 m
- -2 m
- -3 m
- -4 m
- -5 m
- -6 m
- -7 m
- -8 m
Consider the v-t graph below. What is the displacement during the time interval from t = 2 s to t = 4 s?
- 8 m
- 7 m
- 6 m
- 5 m
- 4 m
- 3 m
- 2 m
- 1 m
- 0 m
- -1 m
- -2 m
- -3 m
- -4 m
- -5 m
- -6 m
- -7 m
- -8 m
Consider the v-t graph below. What is the displacement during the time interval from t = 2 s to t = 4 s?
- 8 m
- 7 m
- 6 m
- 5 m
- 4 m
- 3 m
- 2 m
- 1 m
- 0 m
- -1 m
- -2 m
- -3 m
- -4 m
- -5 m
- -6 m
- -7 m
- -8 m
Consider the v-t graph below. What is the displacement during the time interval from t = 0 s to t = 2 s?
- 8 m
- 7 m
- 6 m
- 5 m
- 4 m
- 3 m
- 2 m
- 1 m
- 0 m
- -1 m
- -2 m
- -3 m
- -4 m
- -5 m
- -6 m
- -7 m
- -8 m
Consider the v-t graph below. What is the displacement during the time interval from t = 2 s to t = 4 s?
- 8 m
- 7 m
- 6 m
- 5 m
- 4 m
- 3 m
- 2 m
- 1 m
- 0 m
- -1 m
- -2 m
- -3 m
- -4 m
- -5 m
- -6 m
- -7 m
- -8 m
Consider the v-t graph below. What is the displacement during the time interval from t = 2 s to t = 4 s?
- 8 m
- 7 m
- 6 m
- 5 m
- 4 m
- 3 m
- 2 m
- 1 m
- 0 m
- -1 m
- -2 m
- -3 m
- -4 m
- -5 m
- -6 m
- -7 m
- -8 m
Consider the v-t graph below. What is the displacement during the time interval from t = 2 s to t = 4 s?
- 8 m
- 7 m
- 6 m
- 5 m
- 4 m
- 3 m
- 2 m
- 1 m
- 0 m
- -1 m
- -2 m
- -3 m
- -4 m
- -5 m
- -6 m
- -7 m
- -8 m
Consider the v-t graph below. What is the displacement during the time interval from t = 4 s to t = 6 s?
- 8 m
- 7 m
- 6 m
- 5 m
- 4 m
- 3 m
- 2 m
- 1 m
- 0 m
- -1 m
- -2 m
- -3 m
- -4 m
- -5 m
- -6 m
- -7 m
- -8 m
Consider the v-t graph below. What is the displacement during the time interval from t = 4 s to t = 6 s?
- 8 m
- 7 m
- 6 m
- 5 m
- 4 m
- 3 m
- 2 m
- 1 m
- 0 m
- -1 m
- -2 m
- -3 m
- -4 m
- -5 m
- -6 m
- -7 m
- -8 m
Consider the v-t graph below. What is the displacement during the time interval from t = 2 s to t = 6 s?
- 8 m
- 7 m
- 6 m
- 5 m
- 4 m
- 3 m
- 2 m
- 1 m
- 0 m
- -1 m
- -2 m
- -3 m
- -4 m
- -5 m
- -6 m
- -7 m
- -8 m
Consider the v-t graph below. What is the displacement during the time interval from t = 2 s to t = 6 s?
- 8 m
- 7 m
- 6 m
- 5 m
- 4 m
- 3 m
- 2 m
- 1 m
- 0 m
- -1 m
- -2 m
- -3 m
- -4 m
- -5 m
- -6 m
- -7 m
- -8 m
Consider the v-t graph below. What is the displacement during the time interval from t = 2 s to t = 6 s?
- 8 m
- 7 m
- 6 m
- 5 m
- 4 m
- 3 m
- 2 m
- 1 m
- 0 m
- -1 m
- -2 m
- -3 m
- -4 m
- -5 m
- -6 m
- -7 m
- -8 m
Consider the v-t graph below. What is the displacement during the time interval from t = 2 s to t = 6 s?
- 8 m
- 7 m
- 6 m
- 5 m
- 4 m
- 3 m
- 2 m
- 1 m
- 0 m
- -1 m
- -2 m
- -3 m
- -4 m
- -5 m
- -6 m
- -7 m
- -8 m
Consider the v-t graph below. What is the displacement during the time interval from t = 2 s to t = 6 s?
- 8 m
- 7 m
- 6 m
- 5 m
- 4 m
- 3 m
- 2 m
- 1 m
- 0 m
- -1 m
- -2 m
- -3 m
- -4 m
- -5 m
- -6 m
- -7 m
- -8 m
Consider the v-t graph below. What is the displacement during the time interval from t = 2 s to t = 6 s?
- 8 m
- 7 m
- 6 m
- 5 m
- 4 m
- 3 m
- 2 m
- 1 m
- 0 m
- -1 m
- -2 m
- -3 m
- -4 m
- -5 m
- -6 m
- -7 m
- -8 m
Consider the v-t graph below. What is the displacement during the time interval from t = 2 s to t = 6 s?
- 8 m
- 7 m
- 6 m
- 5 m
- 4 m
- 3 m
- 2 m
- 1 m
- 0 m
- -1 m
- -2 m
- -3 m
- -4 m
- -5 m
- -6 m
- -7 m
- -8 m
Consider the v-t graph below. What is the displacement during the time interval from t = 2 s to t = 6 s?
- 8 m
- 7 m
- 6 m
- 5 m
- 4 m
- 3 m
- 2 m
- 1 m
- 0 m
- -1 m
- -2 m
- -3 m
- -4 m
- -5 m
- -6 m
- -7 m
- -8 m
Consider the v-t graph below. What is the displacement during the time interval from t = 2 s to t = 6 s?
- 8 m
- 7 m
- 6 m
- 5 m
- 4 m
- 3 m
- 2 m
- 1 m
- 0 m
- -1 m
- -2 m
- -3 m
- -4 m
- -5 m
- -6 m
- -7 m
- -8 m
Consider the v-t graph below. What is the displacement during the time interval from t = 2 s to t = 6 s?
- 8 m
- 7 m
- 6 m
- 5 m
- 4 m
- 3 m
- 2 m
- 1 m
- 0 m
- -1 m
- -2 m
- -3 m
- -4 m
- -5 m
- -6 m
- -7 m
- -8 m
Consider the v-t graph below. What is the displacement during the time interval from t = 4 s to t = 6 s?
- 8 m
- 7 m
- 6 m
- 5 m
- 4 m
- 3 m
- 2 m
- 1 m
- 0 m
- -1 m
- -2 m
- -3 m
- -4 m
- -5 m
- -6 m
- -7 m
- -8 m
Consider the v-t graph below. What is the displacement during the time interval from t = 4 s to t = 6 s?
- 8 m
- 7 m
- 6 m
- 5 m
- 4 m
- 3 m
- 2 m
- 1 m
- 0 m
- -1 m
- -2 m
- -3 m
- -4 m
- -5 m
- -6 m
- -7 m
- -8 m
Consider the v-t graph below. What is the displacement during the time interval from t = 4 s to t = 6 s?
- 8 m
- 7 m
- 6 m
- 5 m
- 4 m
- 3 m
- 2 m
- 1 m
- 0 m
- -1 m
- -2 m
- -3 m
- -4 m
- -5 m
- -6 m
- -7 m
- -8 m
Consider the v-t graph below. What is the displacement during the time interval from t = 2 s to t = 4 s?
- 8 m
- 7 m
- 6 m
- 5 m
- 4 m
- 3 m
- 2 m
- 1 m
- 0 m
- -1 m
- -2 m
- -3 m
- -4 m
- -5 m
- -6 m
- -7 m
- -8 m
Consider the v-t graph below. What is the displacement during the time interval from t = 2 s to t = 4 s?
- 8 m
- 7 m
- 6 m
- 5 m
- 4 m
- 3 m
- 2 m
- 1 m
- 0 m
- -1 m
- -2 m
- -3 m
- -4 m
- -5 m
- -6 m
- -7 m
- -8 m
Consider the v-t graph below. What is the displacement during the time interval from t = 2 s to t = 4 s?
- 8 m
- 7 m
- 6 m
- 5 m
- 4 m
- 3 m
- 2 m
- 1 m
- 0 m
- -1 m
- -2 m
- -3 m
- -4 m
- -5 m
- -6 m
- -7 m
- -8 m
Consider the v-t graph below. What is the displacement during the time interval from t = 4 s to t = 6 s?
- 8 m
- 7 m
- 6 m
- 5 m
- 4 m
- 3 m
- 2 m
- 1 m
- 0 m
- -1 m
- -2 m
- -3 m
- -4 m
- -5 m
- -6 m
- -7 m
- -8 m
Consider the v-t graph below. What is the displacement during the time interval from t = 4 s to t = 6 s?
- 8 m
- 7 m
- 6 m
- 5 m
- 4 m
- 3 m
- 2 m
- 1 m
- 0 m
- -1 m
- -2 m
- -3 m
- -4 m
- -5 m
- -6 m
- -7 m
- -8 m
Consider the v-t graph below. What is the displacement during the time interval from t = 4 s to t = 6 s?
- 8 m
- 7 m
- 6 m
- 5 m
- 4 m
- 3 m
- 2 m
- 1 m
- 0 m
- -1 m
- -2 m
- -3 m
- -4 m
- -5 m
- -6 m
- -7 m
- -8 m
Consider the v-t graph below. What is the displacement during the time interval from t = 4 s to t = 6 s?
- 8 m
- 7 m
- 6 m
- 5 m
- 4 m
- 3 m
- 2 m
- 1 m
- 0 m
- -1 m
- -2 m
- -3 m
- -4 m
- -5 m
- -6 m
- -7 m
- -8 m
Consider the v-t graph below. What is the displacement during the time interval from t = 4 s to t = 6 s?
- 8 m
- 7 m
- 6 m
- 5 m
- 4 m
- 3 m
- 2 m
- 1 m
- 0 m
- -1 m
- -2 m
- -3 m
- -4 m
- -5 m
- -6 m
- -7 m
- -8 m
Consider the v-t graph below. What is the displacement during the time interval from t = 4 s to t = 6 s?
- 8 m
- 7 m
- 6 m
- 5 m
- 4 m
- 3 m
- 2 m
- 1 m
- 0 m
- -1 m
- -2 m
- -3 m
- -4 m
- -5 m
- -6 m
- -7 m
- -8 m
Consider the v-t graph below. What is the displacement during the time interval from t = 4 s to t = 8 s?
- 8 m
- 7 m
- 6 m
- 5 m
- 4 m
- 3 m
- 2 m
- 1 m
- 0 m
- -1 m
- -2 m
- -3 m
- -4 m
- -5 m
- -6 m
- -7 m
- -8 m
Consider the v-t graph below. What is the displacement during the time interval from t = 4 s to t = 8 s?
- 8 m
- 7 m
- 6 m
- 5 m
- 4 m
- 3 m
- 2 m
- 1 m
- 0 m
- -1 m
- -2 m
- -3 m
- -4 m
- -5 m
- -6 m
- -7 m
- -8 m
Consider the v-t graph below. What is the displacement during the time interval from t = 4 s to t = 8 s?
- 8 m
- 7 m
- 6 m
- 5 m
- 4 m
- 3 m
- 2 m
- 1 m
- 0 m
- -1 m
- -2 m
- -3 m
- -4 m
- -5 m
- -6 m
- -7 m
- -8 m
Consider the v-t graph below. What is the displacement during the time interval from t = 4 s to t = 8 s?
- 8 m
- 7 m
- 6 m
- 5 m
- 4 m
- 3 m
- 2 m
- 1 m
- 0 m
- -1 m
- -2 m
- -3 m
- -4 m
- -5 m
- -6 m
- -7 m
- -8 m
Consider the v-t graph below. What is the displacement during the time interval from t = 4 s to t = 8 s?
- 8 m
- 7 m
- 6 m
- 5 m
- 4 m
- 3 m
- 2 m
- 1 m
- 0 m
- -1 m
- -2 m
- -3 m
- -4 m
- -5 m
- -6 m
- -7 m
- -8 m
Consider the v-t graph below. What is the displacement during the time interval from t = 4 s to t = 8 s?
- 8 m
- 7 m
- 6 m
- 5 m
- 4 m
- 3 m
- 2 m
- 1 m
- 0 m
- -1 m
- -2 m
- -3 m
- -4 m
- -5 m
- -6 m
- -7 m
- -8 m
Consider the v-t graph below. What is the displacement during the time interval from t = 4 s to t = 8 s?
- 8 m
- 7 m
- 6 m
- 5 m
- 4 m
- 3 m
- 2 m
- 1 m
- 0 m
- -1 m
- -2 m
- -3 m
- -4 m
- -5 m
- -6 m
- -7 m
- -8 m
Consider the v-t graph below. What is the displacement during the time interval from t = 4 s to t = 8 s?
- 8 m
- 7 m
- 6 m
- 5 m
- 4 m
- 3 m
- 2 m
- 1 m
- 0 m
- -1 m
- -2 m
- -3 m
- -4 m
- -5 m
- -6 m
- -7 m
- -8 m
Consider the v-t graph below. What is the displacement during the time interval from t = 6 s to t = 8 s?
- 8 m
- 7 m
- 6 m
- 5 m
- 4 m
- 3 m
- 2 m
- 1 m
- 0 m
- -1 m
- -2 m
- -3 m
- -4 m
- -5 m
- -6 m
- -7 m
- -8 m
Consider the v-t graph below. What is the displacement during the time interval from t = 6 s to t = 8 s?
- 8 m
- 7 m
- 6 m
- 5 m
- 4 m
- 3 m
- 2 m
- 1 m
- 0 m
- -1 m
- -2 m
- -3 m
- -4 m
- -5 m
- -6 m
- -7 m
- -8 m
Consider the v-t graph below. What is the displacement during the time interval from t = 6 s to t = 8 s?
- 8 m
- 7 m
- 6 m
- 5 m
- 4 m
- 3 m
- 2 m
- 1 m
- 0 m
- -1 m
- -2 m
- -3 m
- -4 m
- -5 m
- -6 m
- -7 m
- -8 m
Consider the v-t graph below. What is the displacement during the time interval from t = 6 s to t = 8 s?
- 8 m
- 7 m
- 6 m
- 5 m
- 4 m
- 3 m
- 2 m
- 1 m
- 0 m
- -1 m
- -2 m
- -3 m
- -4 m
- -5 m
- -6 m
- -7 m
- -8 m
Consider the v-t graph below. What is the displacement during the time interval from t = 6 s to t = 8 s?
- 8 m
- 7 m
- 6 m
- 5 m
- 4 m
- 3 m
- 2 m
- 1 m
- 0 m
- -1 m
- -2 m
- -3 m
- -4 m
- -5 m
- -6 m
- -7 m
- -8 m
Consider the v-t graph below. What is the displacement during the time interval from t = 6 s to t = 8 s?
- 8 m
- 7 m
- 6 m
- 5 m
- 4 m
- 3 m
- 2 m
- 1 m
- 0 m
- -1 m
- -2 m
- -3 m
- -4 m
- -5 m
- -6 m
- -7 m
- -8 m
Consider the v-t graph below. What is the displacement during the time interval from t = 6 s to t = 8 s?
- 8 m
- 7 m
- 6 m
- 5 m
- 4 m
- 3 m
- 2 m
- 1 m
- 0 m
- -1 m
- -2 m
- -3 m
- -4 m
- -5 m
- -6 m
- -7 m
- -8 m
Consider the v-t graph below. What is the displacement during the time interval from t = 6 s to t = 8 s?
- 8 m
- 7 m
- 6 m
- 5 m
- 4 m
- 3 m
- 2 m
- 1 m
- 0 m
- -1 m
- -2 m
- -3 m
- -4 m
- -5 m
- -6 m
- -7 m
- -8 m
Consider the v-t graph below. What is the displacement during the time interval from t = 6 s to t = 8 s?
- 8 m
- 7 m
- 6 m
- 5 m
- 4 m
- 3 m
- 2 m
- 1 m
- 0 m
- -1 m
- -2 m
- -3 m
- -4 m
- -5 m
- -6 m
- -7 m
- -8 m
Consider the v-t graph below. What is the displacement during the time interval from t = 6 s to t = 8 s?
- 8 m
- 7 m
- 6 m
- 5 m
- 4 m
- 3 m
- 2 m
- 1 m
- 0 m
- -1 m
- -2 m
- -3 m
- -4 m
- -5 m
- -6 m
- -7 m
- -8 m
Consider the v-t graph below. What is the displacement during the time interval from t = 6 s to t = 8 s?
- 8 m
- 7 m
- 6 m
- 5 m
- 4 m
- 3 m
- 2 m
- 1 m
- 0 m
- -1 m
- -2 m
- -3 m
- -4 m
- -5 m
- -6 m
- -7 m
- -8 m
Consider the v-t graph below. What is the displacement during the time interval from t = 6 s to t = 8 s?
- 8 m
- 7 m
- 6 m
- 5 m
- 4 m
- 3 m
- 2 m
- 1 m
- 0 m
- -1 m
- -2 m
- -3 m
- -4 m
- -5 m
- -6 m
- -7 m
- -8 m
Consider the v-t graph below. What is the displacement during the time interval from t = 6 s to t = 8 s?
- 8 m
- 7 m
- 6 m
- 5 m
- 4 m
- 3 m
- 2 m
- 1 m
- 0 m
- -1 m
- -2 m
- -3 m
- -4 m
- -5 m
- -6 m
- -7 m
- -8 m
Consider the v-t graph below. What is the displacement during the time interval from t = 6 s to t = 8 s?
- 8 m
- 7 m
- 6 m
- 5 m
- 4 m
- 3 m
- 2 m
- 1 m
- 0 m
- -1 m
- -2 m
- -3 m
- -4 m
- -5 m
- -6 m
- -7 m
- -8 m
Consider the v-t graph below. What is the displacement during the time interval from t = 6 s to t = 8 s?
- 8 m
- 7 m
- 6 m
- 5 m
- 4 m
- 3 m
- 2 m
- 1 m
- 0 m
- -1 m
- -2 m
- -3 m
- -4 m
- -5 m
- -6 m
- -7 m
- -8 m
Consider the v-t graph below. What is the displacement during the time interval from t = 6 s to t = 8 s?
- 8 m
- 7 m
- 6 m
- 5 m
- 4 m
- 3 m
- 2 m
- 1 m
- 0 m
- -1 m
- -2 m
- -3 m
- -4 m
- -5 m
- -6 m
- -7 m
- -8 m
Consider the v-t graph below. What is the displacement during the time interval from t = 6 s to t = 8 s?
- 8 m
- 7 m
- 6 m
- 5 m
- 4 m
- 3 m
- 2 m
- 1 m
- 0 m
- -1 m
- -2 m
- -3 m
- -4 m
- -5 m
- -6 m
- -7 m
- -8 m
Consider the v-t graph below. What is the displacement during the time interval from t = 4 s to t = 8 s?
- 8 m
- 7 m
- 6 m
- 5 m
- 4 m
- 3 m
- 2 m
- 1 m
- 0 m
- -1 m
- -2 m
- -3 m
- -4 m
- -5 m
- -6 m
- -7 m
- -8 m
Consider the v-t graph below. What is the displacement during the time interval from t = 4 s to t = 8 s?
- 8 m
- 7 m
- 6 m
- 5 m
- 4 m
- 3 m
- 2 m
- 1 m
- 0 m
- -1 m
- -2 m
- -3 m
- -4 m
- -5 m
- -6 m
- -7 m
- -8 m
Consider the v-t graph below. What is the displacement during the time interval from t = 6 s to t = 8 s?
- 8 m
- 7 m
- 6 m
- 5 m
- 4 m
- 3 m
- 2 m
- 1 m
- 0 m
- -1 m
- -2 m
- -3 m
- -4 m
- -5 m
- -6 m
- -7 m
- -8 m
Consider the v-t graph below. What is the displacement during the time interval from t = 6 s to t = 8 s?
- 8 m
- 7 m
- 6 m
- 5 m
- 4 m
- 3 m
- 2 m
- 1 m
- 0 m
- -1 m
- -2 m
- -3 m
- -4 m
- -5 m
- -6 m
- -7 m
- -8 m
Consider the v-t graph below. What is the displacement during the time interval from t = 6 s to t = 8 s?
- 8 m
- 7 m
- 6 m
- 5 m
- 4 m
- 3 m
- 2 m
- 1 m
- 0 m
- -1 m
- -2 m
- -3 m
- -4 m
- -5 m
- -6 m
- -7 m
- -8 m
Consider the v-t graph below. What is the displacement during the time interval from t = 6 s to t = 8 s?
- 8 m
- 7 m
- 6 m
- 5 m
- 4 m
- 3 m
- 2 m
- 1 m
- 0 m
- -1 m
- -2 m
- -3 m
- -4 m
- -5 m
- -6 m
- -7 m
- -8 m
Consider the v-t graph below. What is the displacement during the time interval from t = 6 s to t = 8 s?
- 8 m
- 7 m
- 6 m
- 5 m
- 4 m
- 3 m
- 2 m
- 1 m
- 0 m
- -1 m
- -2 m
- -3 m
- -4 m
- -5 m
- -6 m
- -7 m
- -8 m
Consider the v-t graph below. What is the displacement during the time interval from t = 6 s to t = 8 s?
- 8 m
- 7 m
- 6 m
- 5 m
- 4 m
- 3 m
- 2 m
- 1 m
- 0 m
- -1 m
- -2 m
- -3 m
- -4 m
- -5 m
- -6 m
- -7 m
- -8 m
Consider the v-t graph below. What is the total displacement during the entire time interval from t = 0 s to t = 8 s?
- 8 m
- 7 m
- 6 m
- 5 m
- 4 m
- 3 m
- 2 m
- 1 m
- 0 m
- -1 m
- -2 m
- -3 m
- -4 m
- -5 m
- -6 m
- -7 m
- -8 m
Consider the v-t graph below. What is the total displacement during the entire time interval from t = 0 s to t = 8 s?
- 8 m
- 7 m
- 6 m
- 5 m
- 4 m
- 3 m
- 2 m
- 1 m
- 0 m
- -1 m
- -2 m
- -3 m
- -4 m
- -5 m
- -6 m
- -7 m
- -8 m
Consider the v-t graph below. What is the total displacement during the entire time interval from t = 0 s to t = 8 s?
- 8 m
- 7 m
- 6 m
- 5 m
- 4 m
- 3 m
- 2 m
- 1 m
- 0 m
- -1 m
- -2 m
- -3 m
- -4 m
- -5 m
- -6 m
- -7 m
- -8 m
Consider the v-t graph below. What is the total displacement during the entire time interval from t = 0 s to t = 8 s?
- 8 m
- 7 m
- 6 m
- 5 m
- 4 m
- 3 m
- 2 m
- 1 m
- 0 m
- -1 m
- -2 m
- -3 m
- -4 m
- -5 m
- -6 m
- -7 m
- -8 m
Consider the v-t graph below. What is the total displacement during the entire time interval from t = 0 s to t = 8 s?
- 8 m
- 7 m
- 6 m
- 5 m
- 4 m
- 3 m
- 2 m
- 1 m
- 0 m
- -1 m
- -2 m
- -3 m
- -4 m
- -5 m
- -6 m
- -7 m
- -8 m
Consider the v-t graph below. What is the total displacement during the entire time interval from t = 0 s to t = 8 s?
- 8 m
- 7 m
- 6 m
- 5 m
- 4 m
- 3 m
- 2 m
- 1 m
- 0 m
- -1 m
- -2 m
- -3 m
- -4 m
- -5 m
- -6 m
- -7 m
- -8 m
Consider the v-t graph below. What is the total displacement during the entire time interval from t = 0 s to t = 8 s?
- 8 m
- 7 m
- 6 m
- 5 m
- 4 m
- 3 m
- 2 m
- 1 m
- 0 m
- -1 m
- -2 m
- -3 m
- -4 m
- -5 m
- -6 m
- -7 m
- -8 m
Consider the v-t graph below. What is the total displacement during the entire time interval from t = 0 s to t = 8 s?
- 8 m
- 7 m
- 6 m
- 5 m
- 4 m
- 3 m
- 2 m
- 1 m
- 0 m
- -1 m
- -2 m
- -3 m
- -4 m
- -5 m
- -6 m
- -7 m
- -8 m
Consider the v-t graph below. What is the total displacement during the entire time interval from t = 0 s to t = 8 s?
- 8 m
- 7 m
- 6 m
- 5 m
- 4 m
- 3 m
- 2 m
- 1 m
- 0 m
- -1 m
- -2 m
- -3 m
- -4 m
- -5 m
- -6 m
- -7 m
- -8 m
Consider the v-t graph below. What is the total displacement during the entire time interval from t = 0 s to t = 8 s?
- 8 m
- 7 m
- 6 m
- 5 m
- 4 m
- 3 m
- 2 m
- 1 m
- 0 m
- -1 m
- -2 m
- -3 m
- -4 m
- -5 m
- -6 m
- -7 m
- -8 m
Consider the v-t graph below. What is the total displacement during the entire time interval from t = 0 s to t = 8 s?
- 8 m
- 7 m
- 6 m
- 5 m
- 4 m
- 3 m
- 2 m
- 1 m
- 0 m
- -1 m
- -2 m
- -3 m
- -4 m
- -5 m
- -6 m
- -7 m
- -8 m
Consider the v-t graph below. What is the total displacement during the entire time interval from t = 0 s to t = 8 s?
- 8 m
- 7 m
- 6 m
- 5 m
- 4 m
- 3 m
- 2 m
- 1 m
- 0 m
- -1 m
- -2 m
- -3 m
- -4 m
- -5 m
- -6 m
- -7 m
- -8 m
Consider the v-t graph below. What is the average velocity during the time interval from t = 0 s to t = 2 s?
- 4.0 m/s
- 3.5 m/s
- 3.0 m/s
- 2.5 m/s
- 2.0 m/s
- 1.5 m/s
- 1.0 m/s
- 0.5 m/s
- 0.0 m/s
- -0.5 m/s
- -1.0 m/s
- -1.5 m/s
- -2.0 m/s
- -2.5 m/s
- -3.0 m/s
- -3.5 m/s
- -4.0 m/s
Consider the v-t graph below. What is the average velocity during the time interval from t = 0 s to t = 2 s?
- 4.0 m/s
- 3.5 m/s
- 3.0 m/s
- 2.5 m/s
- 2.0 m/s
- 1.5 m/s
- 1.0 m/s
- 0.5 m/s
- 0.0 m/s
- -0.5 m/s
- -1.0 m/s
- -1.5 m/s
- -2.0 m/s
- -2.5 m/s
- -3.0 m/s
- -3.5 m/s
- -4.0 m/s
Consider the v-t graph below. What is the average velocity during the time interval from t = 0 s to t = 2 s?
- 4.0 m/s
- 3.5 m/s
- 3.0 m/s
- 2.5 m/s
- 2.0 m/s
- 1.5 m/s
- 1.0 m/s
- 0.5 m/s
- 0.0 m/s
- -0.5 m/s
- -1.0 m/s
- -1.5 m/s
- -2.0 m/s
- -2.5 m/s
- -3.0 m/s
- -3.5 m/s
- -4.0 m/s
Consider the v-t graph below. What is the average velocity during the time interval from t = 0 s to t = 2 s?
- 4.0 m/s
- 3.5 m/s
- 3.0 m/s
- 2.5 m/s
- 2.0 m/s
- 1.5 m/s
- 1.0 m/s
- 0.5 m/s
- 0.0 m/s
- -0.5 m/s
- -1.0 m/s
- -1.5 m/s
- -2.0 m/s
- -2.5 m/s
- -3.0 m/s
- -3.5 m/s
- -4.0 m/s
Consider the v-t graph below. What is the average velocity during the time interval from t = 0 s to t = 2 s?
- 4.0 m/s
- 3.5 m/s
- 3.0 m/s
- 2.5 m/s
- 2.0 m/s
- 1.5 m/s
- 1.0 m/s
- 0.5 m/s
- 0.0 m/s
- -0.5 m/s
- -1.0 m/s
- -1.5 m/s
- -2.0 m/s
- -2.5 m/s
- -3.0 m/s
- -3.5 m/s
- -4.0 m/s
Consider the v-t graph below. What is the average velocity during the time interval from t = 0 s to t = 2 s?
- 4.0 m/s
- 3.5 m/s
- 3.0 m/s
- 2.5 m/s
- 2.0 m/s
- 1.5 m/s
- 1.0 m/s
- 0.5 m/s
- 0.0 m/s
- -0.5 m/s
- -1.0 m/s
- -1.5 m/s
- -2.0 m/s
- -2.5 m/s
- -3.0 m/s
- -3.5 m/s
- -4.0 m/s
Consider the v-t graph below. What is the average velocity during the time interval from t = 0 s to t = 2 s?
- 4.0 m/s
- 3.5 m/s
- 3.0 m/s
- 2.5 m/s
- 2.0 m/s
- 1.5 m/s
- 1.0 m/s
- 0.5 m/s
- 0.0 m/s
- -0.5 m/s
- -1.0 m/s
- -1.5 m/s
- -2.0 m/s
- -2.5 m/s
- -3.0 m/s
- -3.5 m/s
- -4.0 m/s
Consider the v-t graph below. What is the average velocity during the time interval from t = 0 s to t = 2 s?
- 4.0 m/s
- 3.5 m/s
- 3.0 m/s
- 2.5 m/s
- 2.0 m/s
- 1.5 m/s
- 1.0 m/s
- 0.5 m/s
- 0.0 m/s
- -0.5 m/s
- -1.0 m/s
- -1.5 m/s
- -2.0 m/s
- -2.5 m/s
- -3.0 m/s
- -3.5 m/s
- -4.0 m/s
Consider the v-t graph below. What is the average velocity during the time interval from t = 0 s to t = 4 s?
- 4.0 m/s
- 3.5 m/s
- 3.0 m/s
- 2.5 m/s
- 2.0 m/s
- 1.5 m/s
- 1.0 m/s
- 0.5 m/s
- 0.0 m/s
- -0.5 m/s
- -1.0 m/s
- -1.5 m/s
- -2.0 m/s
- -2.5 m/s
- -3.0 m/s
- -3.5 m/s
- -4.0 m/s
Consider the v-t graph below. What is the average velocity during the time interval from t = 0 s to t = 4 s?
- 4.0 m/s
- 3.5 m/s
- 3.0 m/s
- 2.5 m/s
- 2.0 m/s
- 1.5 m/s
- 1.0 m/s
- 0.5 m/s
- 0.0 m/s
- -0.5 m/s
- -1.0 m/s
- -1.5 m/s
- -2.0 m/s
- -2.5 m/s
- -3.0 m/s
- -3.5 m/s
- -4.0 m/s
Consider the v-t graph below. What is the average velocity during the time interval from t = 0 s to t = 2 s?
- 4.0 m/s
- 3.5 m/s
- 3.0 m/s
- 2.5 m/s
- 2.0 m/s
- 1.5 m/s
- 1.0 m/s
- 0.5 m/s
- 0.0 m/s
- -0.5 m/s
- -1.0 m/s
- -1.5 m/s
- -2.0 m/s
- -2.5 m/s
- -3.0 m/s
- -3.5 m/s
- -4.0 m/s
Consider the v-t graph below. What is the average velocity during the time interval from t = 0 s to t = 2 s?
- 4.0 m/s
- 3.5 m/s
- 3.0 m/s
- 2.5 m/s
- 2.0 m/s
- 1.5 m/s
- 1.0 m/s
- 0.5 m/s
- 0.0 m/s
- -0.5 m/s
- -1.0 m/s
- -1.5 m/s
- -2.0 m/s
- -2.5 m/s
- -3.0 m/s
- -3.5 m/s
- -4.0 m/s
Consider the v-t graph below. What is the average velocity during the time interval from t = 0 s to t = 2 s?
- 4.0 m/s
- 3.5 m/s
- 3.0 m/s
- 2.5 m/s
- 2.0 m/s
- 1.5 m/s
- 1.0 m/s
- 0.5 m/s
- 0.0 m/s
- -0.5 m/s
- -1.0 m/s
- -1.5 m/s
- -2.0 m/s
- -2.5 m/s
- -3.0 m/s
- -3.5 m/s
- -4.0 m/s
Consider the v-t graph below. What is the average velocity during the time interval from t = 0 s to t = 2 s?
- 4.0 m/s
- 3.5 m/s
- 3.0 m/s
- 2.5 m/s
- 2.0 m/s
- 1.5 m/s
- 1.0 m/s
- 0.5 m/s
- 0.0 m/s
- -0.5 m/s
- -1.0 m/s
- -1.5 m/s
- -2.0 m/s
- -2.5 m/s
- -3.0 m/s
- -3.5 m/s
- -4.0 m/s
Consider the v-t graph below. What is the average velocity during the time interval from t = 0 s to t = 2 s?
- 4.0 m/s
- 3.5 m/s
- 3.0 m/s
- 2.5 m/s
- 2.0 m/s
- 1.5 m/s
- 1.0 m/s
- 0.5 m/s
- 0.0 m/s
- -0.5 m/s
- -1.0 m/s
- -1.5 m/s
- -2.0 m/s
- -2.5 m/s
- -3.0 m/s
- -3.5 m/s
- -4.0 m/s
Consider the v-t graph below. What is the average velocity during the time interval from t = 0 s to t = 2 s?
- 4.0 m/s
- 3.5 m/s
- 3.0 m/s
- 2.5 m/s
- 2.0 m/s
- 1.5 m/s
- 1.0 m/s
- 0.5 m/s
- 0.0 m/s
- -0.5 m/s
- -1.0 m/s
- -1.5 m/s
- -2.0 m/s
- -2.5 m/s
- -3.0 m/s
- -3.5 m/s
- -4.0 m/s
Consider the v-t graph below. What is the average velocity during the time interval from t = 0 s to t = 2 s?
- 4.0 m/s
- 3.5 m/s
- 3.0 m/s
- 2.5 m/s
- 2.0 m/s
- 1.5 m/s
- 1.0 m/s
- 0.5 m/s
- 0.0 m/s
- -0.5 m/s
- -1.0 m/s
- -1.5 m/s
- -2.0 m/s
- -2.5 m/s
- -3.0 m/s
- -3.5 m/s
- -4.0 m/s
Consider the v-t graph below. What is the average velocity during the time interval from t = 0 s to t = 2 s?
- 4.0 m/s
- 3.5 m/s
- 3.0 m/s
- 2.5 m/s
- 2.0 m/s
- 1.5 m/s
- 1.0 m/s
- 0.5 m/s
- 0.0 m/s
- -0.5 m/s
- -1.0 m/s
- -1.5 m/s
- -2.0 m/s
- -2.5 m/s
- -3.0 m/s
- -3.5 m/s
- -4.0 m/s
Consider the v-t graph below. What is the average velocity during the time interval from t = 0 s to t = 2 s?
- 4.0 m/s
- 3.5 m/s
- 3.0 m/s
- 2.5 m/s
- 2.0 m/s
- 1.5 m/s
- 1.0 m/s
- 0.5 m/s
- 0.0 m/s
- -0.5 m/s
- -1.0 m/s
- -1.5 m/s
- -2.0 m/s
- -2.5 m/s
- -3.0 m/s
- -3.5 m/s
- -4.0 m/s
Consider the v-t graph below. What is the average velocity during the time interval from t = 0 s to t = 2 s?
- 4.0 m/s
- 3.5 m/s
- 3.0 m/s
- 2.5 m/s
- 2.0 m/s
- 1.5 m/s
- 1.0 m/s
- 0.5 m/s
- 0.0 m/s
- -0.5 m/s
- -1.0 m/s
- -1.5 m/s
- -2.0 m/s
- -2.5 m/s
- -3.0 m/s
- -3.5 m/s
- -4.0 m/s
Consider the v-t graph below. What is the average velocity during the time interval from t = 0 s to t = 2 s?
- 4.0 m/s
- 3.5 m/s
- 3.0 m/s
- 2.5 m/s
- 2.0 m/s
- 1.5 m/s
- 1.0 m/s
- 0.5 m/s
- 0.0 m/s
- -0.5 m/s
- -1.0 m/s
- -1.5 m/s
- -2.0 m/s
- -2.5 m/s
- -3.0 m/s
- -3.5 m/s
- -4.0 m/s
Consider the v-t graph below. What is the average velocity during the time interval from t = 0 s to t = 2 s?
- 4.0 m/s
- 3.5 m/s
- 3.0 m/s
- 2.5 m/s
- 2.0 m/s
- 1.5 m/s
- 1.0 m/s
- 0.5 m/s
- 0.0 m/s
- -0.5 m/s
- -1.0 m/s
- -1.5 m/s
- -2.0 m/s
- -2.5 m/s
- -3.0 m/s
- -3.5 m/s
- -4.0 m/s
Consider the v-t graph below. What is the average velocity during the time interval from t = 0 s to t = 4 s?
- 4.0 m/s
- 3.5 m/s
- 3.0 m/s
- 2.5 m/s
- 2.0 m/s
- 1.5 m/s
- 1.0 m/s
- 0.5 m/s
- 0.0 m/s
- -0.5 m/s
- -1.0 m/s
- -1.5 m/s
- -2.0 m/s
- -2.5 m/s
- -3.0 m/s
- -3.5 m/s
- -4.0 m/s
Consider the v-t graph below. What is the average velocity during the time interval from t = 0 s to t = 4 s?
- 4.0 m/s
- 3.5 m/s
- 3.0 m/s
- 2.5 m/s
- 2.0 m/s
- 1.5 m/s
- 1.0 m/s
- 0.5 m/s
- 0.0 m/s
- -0.5 m/s
- -1.0 m/s
- -1.5 m/s
- -2.0 m/s
- -2.5 m/s
- -3.0 m/s
- -3.5 m/s
- -4.0 m/s
Consider the v-t graph below. What is the average velocity during the time interval from t = 0 s to t = 4 s?
- 4.0 m/s
- 3.5 m/s
- 3.0 m/s
- 2.5 m/s
- 2.0 m/s
- 1.5 m/s
- 1.0 m/s
- 0.5 m/s
- 0.0 m/s
- -0.5 m/s
- -1.0 m/s
- -1.5 m/s
- -2.0 m/s
- -2.5 m/s
- -3.0 m/s
- -3.5 m/s
- -4.0 m/s
Consider the v-t graph below. What is the average velocity during the time interval from t = 0 s to t = 2 s?
- 4.0 m/s
- 3.5 m/s
- 3.0 m/s
- 2.5 m/s
- 2.0 m/s
- 1.5 m/s
- 1.0 m/s
- 0.5 m/s
- 0.0 m/s
- -0.5 m/s
- -1.0 m/s
- -1.5 m/s
- -2.0 m/s
- -2.5 m/s
- -3.0 m/s
- -3.5 m/s
- -4.0 m/s
Consider the v-t graph below. What is the average velocity during the time interval from t = 0 s to t = 2 s?
- 4.0 m/s
- 3.5 m/s
- 3.0 m/s
- 2.5 m/s
- 2.0 m/s
- 1.5 m/s
- 1.0 m/s
- 0.5 m/s
- 0.0 m/s
- -0.5 m/s
- -1.0 m/s
- -1.5 m/s
- -2.0 m/s
- -2.5 m/s
- -3.0 m/s
- -3.5 m/s
- -4.0 m/s
Consider the v-t graph below. What is the average velocity during the time interval from t = 0 s to t = 2 s?
- 4.0 m/s
- 3.5 m/s
- 3.0 m/s
- 2.5 m/s
- 2.0 m/s
- 1.5 m/s
- 1.0 m/s
- 0.5 m/s
- 0.0 m/s
- -0.5 m/s
- -1.0 m/s
- -1.5 m/s
- -2.0 m/s
- -2.5 m/s
- -3.0 m/s
- -3.5 m/s
- -4.0 m/s
Consider the v-t graph below. What is the average velocity during the time interval from t = 0 s to t = 4 s?
- 4.0 m/s
- 3.5 m/s
- 3.0 m/s
- 2.5 m/s
- 2.0 m/s
- 1.5 m/s
- 1.0 m/s
- 0.5 m/s
- 0.0 m/s
- -0.5 m/s
- -1.0 m/s
- -1.5 m/s
- -2.0 m/s
- -2.5 m/s
- -3.0 m/s
- -3.5 m/s
- -4.0 m/s
Consider the v-t graph below. What is the average velocity during the time interval from t = 0 s to t = 4 s?
- 4.0 m/s
- 3.5 m/s
- 3.0 m/s
- 2.5 m/s
- 2.0 m/s
- 1.5 m/s
- 1.0 m/s
- 0.5 m/s
- 0.0 m/s
- -0.5 m/s
- -1.0 m/s
- -1.5 m/s
- -2.0 m/s
- -2.5 m/s
- -3.0 m/s
- -3.5 m/s
- -4.0 m/s
Consider the v-t graph below. What is the average velocity during the time interval from t = 0 s to t = 4 s?
- 4.0 m/s
- 3.5 m/s
- 3.0 m/s
- 2.5 m/s
- 2.0 m/s
- 1.5 m/s
- 1.0 m/s
- 0.5 m/s
- 0.0 m/s
- -0.5 m/s
- -1.0 m/s
- -1.5 m/s
- -2.0 m/s
- -2.5 m/s
- -3.0 m/s
- -3.5 m/s
- -4.0 m/s
Consider the v-t graph below. What is the average velocity during the time interval from t = 0 s to t = 4 s?
- 4.0 m/s
- 3.5 m/s
- 3.0 m/s
- 2.5 m/s
- 2.0 m/s
- 1.5 m/s
- 1.0 m/s
- 0.5 m/s
- 0.0 m/s
- -0.5 m/s
- -1.0 m/s
- -1.5 m/s
- -2.0 m/s
- -2.5 m/s
- -3.0 m/s
- -3.5 m/s
- -4.0 m/s
Consider the v-t graph below. What is the average velocity during the time interval from t = 0 s to t = 4 s?
- 4.0 m/s
- 3.5 m/s
- 3.0 m/s
- 2.5 m/s
- 2.0 m/s
- 1.5 m/s
- 1.0 m/s
- 0.5 m/s
- 0.0 m/s
- -0.5 m/s
- -1.0 m/s
- -1.5 m/s
- -2.0 m/s
- -2.5 m/s
- -3.0 m/s
- -3.5 m/s
- -4.0 m/s
Consider the v-t graph below. What is the average velocity during the time interval from t = 0 s to t = 4 s?
- 4.0 m/s
- 3.5 m/s
- 3.0 m/s
- 2.5 m/s
- 2.0 m/s
- 1.5 m/s
- 1.0 m/s
- 0.5 m/s
- 0.0 m/s
- -0.5 m/s
- -1.0 m/s
- -1.5 m/s
- -2.0 m/s
- -2.5 m/s
- -3.0 m/s
- -3.5 m/s
- -4.0 m/s
Consider the v-t graph below. What is the average velocity during the time interval from t = 2 s to t = 4 s?
- 4.0 m/s
- 3.5 m/s
- 3.0 m/s
- 2.5 m/s
- 2.0 m/s
- 1.5 m/s
- 1.0 m/s
- 0.5 m/s
- 0.0 m/s
- -0.5 m/s
- -1.0 m/s
- -1.5 m/s
- -2.0 m/s
- -2.5 m/s
- -3.0 m/s
- -3.5 m/s
- -4.0 m/s
Consider the v-t graph below. What is the average velocity during the time interval from t = 2 s to t = 4 s?
- 4.0 m/s
- 3.5 m/s
- 3.0 m/s
- 2.5 m/s
- 2.0 m/s
- 1.5 m/s
- 1.0 m/s
- 0.5 m/s
- 0.0 m/s
- -0.5 m/s
- -1.0 m/s
- -1.5 m/s
- -2.0 m/s
- -2.5 m/s
- -3.0 m/s
- -3.5 m/s
- -4.0 m/s
Consider the v-t graph below. What is the average velocity during the time interval from t = 2 s to t = 4 s?
- 4.0 m/s
- 3.5 m/s
- 3.0 m/s
- 2.5 m/s
- 2.0 m/s
- 1.5 m/s
- 1.0 m/s
- 0.5 m/s
- 0.0 m/s
- -0.5 m/s
- -1.0 m/s
- -1.5 m/s
- -2.0 m/s
- -2.5 m/s
- -3.0 m/s
- -3.5 m/s
- -4.0 m/s
Consider the v-t graph below. What is the average velocity during the time interval from t = 2 s to t = 4 s?
- 4.0 m/s
- 3.5 m/s
- 3.0 m/s
- 2.5 m/s
- 2.0 m/s
- 1.5 m/s
- 1.0 m/s
- 0.5 m/s
- 0.0 m/s
- -0.5 m/s
- -1.0 m/s
- -1.5 m/s
- -2.0 m/s
- -2.5 m/s
- -3.0 m/s
- -3.5 m/s
- -4.0 m/s
Consider the v-t graph below. What is the average velocity during the time interval from t = 2 s to t = 4 s?
- 4.0 m/s
- 3.5 m/s
- 3.0 m/s
- 2.5 m/s
- 2.0 m/s
- 1.5 m/s
- 1.0 m/s
- 0.5 m/s
- 0.0 m/s
- -0.5 m/s
- -1.0 m/s
- -1.5 m/s
- -2.0 m/s
- -2.5 m/s
- -3.0 m/s
- -3.5 m/s
- -4.0 m/s
Consider the v-t graph below. What is the average velocity during the time interval from t = 2 s to t = 4 s?
- 4.0 m/s
- 3.5 m/s
- 3.0 m/s
- 2.5 m/s
- 2.0 m/s
- 1.5 m/s
- 1.0 m/s
- 0.5 m/s
- 0.0 m/s
- -0.5 m/s
- -1.0 m/s
- -1.5 m/s
- -2.0 m/s
- -2.5 m/s
- -3.0 m/s
- -3.5 m/s
- -4.0 m/s
Consider the v-t graph below. What is the average velocity during the time interval from t = 2 s to t = 4 s?
- 4.0 m/s
- 3.5 m/s
- 3.0 m/s
- 2.5 m/s
- 2.0 m/s
- 1.5 m/s
- 1.0 m/s
- 0.5 m/s
- 0.0 m/s
- -0.5 m/s
- -1.0 m/s
- -1.5 m/s
- -2.0 m/s
- -2.5 m/s
- -3.0 m/s
- -3.5 m/s
- -4.0 m/s
Consider the v-t graph below. What is the average velocity during the time interval from t = 2 s to t = 4 s?
- 4.0 m/s
- 3.5 m/s
- 3.0 m/s
- 2.5 m/s
- 2.0 m/s
- 1.5 m/s
- 1.0 m/s
- 0.5 m/s
- 0.0 m/s
- -0.5 m/s
- -1.0 m/s
- -1.5 m/s
- -2.0 m/s
- -2.5 m/s
- -3.0 m/s
- -3.5 m/s
- -4.0 m/s
Consider the v-t graph below. What is the average velocity during the time interval from t = 4 s to t = 6 s?
- 4.0 m/s
- 3.5 m/s
- 3.0 m/s
- 2.5 m/s
- 2.0 m/s
- 1.5 m/s
- 1.0 m/s
- 0.5 m/s
- 0.0 m/s
- -0.5 m/s
- -1.0 m/s
- -1.5 m/s
- -2.0 m/s
- -2.5 m/s
- -3.0 m/s
- -3.5 m/s
- -4.0 m/s
Consider the v-t graph below. What is the average velocity during the time interval from t = 4 s to t = 6 s?
- 4.0 m/s
- 3.5 m/s
- 3.0 m/s
- 2.5 m/s
- 2.0 m/s
- 1.5 m/s
- 1.0 m/s
- 0.5 m/s
- 0.0 m/s
- -0.5 m/s
- -1.0 m/s
- -1.5 m/s
- -2.0 m/s
- -2.5 m/s
- -3.0 m/s
- -3.5 m/s
- -4.0 m/s
Consider the v-t graph below. What is the average velocity during the time interval from t = 2 s to t = 6 s?
- 4.0 m/s
- 3.5 m/s
- 3.0 m/s
- 2.5 m/s
- 2.0 m/s
- 1.5 m/s
- 1.0 m/s
- 0.5 m/s
- 0.0 m/s
- -0.5 m/s
- -1.0 m/s
- -1.5 m/s
- -2.0 m/s
- -2.5 m/s
- -3.0 m/s
- -3.5 m/s
- -4.0 m/s
Consider the v-t graph below. What is the average velocity during the time interval from t = 2 s to t = 6 s?
- 4.0 m/s
- 3.5 m/s
- 3.0 m/s
- 2.5 m/s
- 2.0 m/s
- 1.5 m/s
- 1.0 m/s
- 0.5 m/s
- 0.0 m/s
- -0.5 m/s
- -1.0 m/s
- -1.5 m/s
- -2.0 m/s
- -2.5 m/s
- -3.0 m/s
- -3.5 m/s
- -4.0 m/s
Consider the v-t graph below. What is the average velocity during the time interval from t = 2 s to t = 6 s?
- 4.0 m/s
- 3.5 m/s
- 3.0 m/s
- 2.5 m/s
- 2.0 m/s
- 1.5 m/s
- 1.0 m/s
- 0.5 m/s
- 0.0 m/s
- -0.5 m/s
- -1.0 m/s
- -1.5 m/s
- -2.0 m/s
- -2.5 m/s
- -3.0 m/s
- -3.5 m/s
- -4.0 m/s
Consider the v-t graph below. What is the average velocity during the time interval from t = 2 s to t = 6 s?
- 4.0 m/s
- 3.5 m/s
- 3.0 m/s
- 2.5 m/s
- 2.0 m/s
- 1.5 m/s
- 1.0 m/s
- 0.5 m/s
- 0.0 m/s
- -0.5 m/s
- -1.0 m/s
- -1.5 m/s
- -2.0 m/s
- -2.5 m/s
- -3.0 m/s
- -3.5 m/s
- -4.0 m/s
Consider the v-t graph below. What is the average velocity during the time interval from t = 2 s to t = 6 s?
- 4.0 m/s
- 3.5 m/s
- 3.0 m/s
- 2.5 m/s
- 2.0 m/s
- 1.5 m/s
- 1.0 m/s
- 0.5 m/s
- 0.0 m/s
- -0.5 m/s
- -1.0 m/s
- -1.5 m/s
- -2.0 m/s
- -2.5 m/s
- -3.0 m/s
- -3.5 m/s
- -4.0 m/s
Consider the v-t graph below. What is the average velocity during the time interval from t = 2 s to t = 6 s?
- 4.0 m/s
- 3.5 m/s
- 3.0 m/s
- 2.5 m/s
- 2.0 m/s
- 1.5 m/s
- 1.0 m/s
- 0.5 m/s
- 0.0 m/s
- -0.5 m/s
- -1.0 m/s
- -1.5 m/s
- -2.0 m/s
- -2.5 m/s
- -3.0 m/s
- -3.5 m/s
- -4.0 m/s
Consider the v-t graph below. What is the average velocity during the time interval from t = 2 s to t = 6 s?
- 4.0 m/s
- 3.5 m/s
- 3.0 m/s
- 2.5 m/s
- 2.0 m/s
- 1.5 m/s
- 1.0 m/s
- 0.5 m/s
- 0.0 m/s
- -0.5 m/s
- -1.0 m/s
- -1.5 m/s
- -2.0 m/s
- -2.5 m/s
- -3.0 m/s
- -3.5 m/s
- -4.0 m/s
Consider the v-t graph below. What is the average velocity during the time interval from t = 2 s to t = 6 s?
- 4.0 m/s
- 3.5 m/s
- 3.0 m/s
- 2.5 m/s
- 2.0 m/s
- 1.5 m/s
- 1.0 m/s
- 0.5 m/s
- 0.0 m/s
- -0.5 m/s
- -1.0 m/s
- -1.5 m/s
- -2.0 m/s
- -2.5 m/s
- -3.0 m/s
- -3.5 m/s
- -4.0 m/s
Consider the v-t graph below. What is the average velocity during the time interval from t = 2 s to t = 6 s?
- 4.0 m/s
- 3.5 m/s
- 3.0 m/s
- 2.5 m/s
- 2.0 m/s
- 1.5 m/s
- 1.0 m/s
- 0.5 m/s
- 0.0 m/s
- -0.5 m/s
- -1.0 m/s
- -1.5 m/s
- -2.0 m/s
- -2.5 m/s
- -3.0 m/s
- -3.5 m/s
- -4.0 m/s
Consider the v-t graph below. What is the average velocity during the time interval from t = 2 s to t = 6 s?
- 4.0 m/s
- 3.5 m/s
- 3.0 m/s
- 2.5 m/s
- 2.0 m/s
- 1.5 m/s
- 1.0 m/s
- 0.5 m/s
- 0.0 m/s
- -0.5 m/s
- -1.0 m/s
- -1.5 m/s
- -2.0 m/s
- -2.5 m/s
- -3.0 m/s
- -3.5 m/s
- -4.0 m/s
Consider the v-t graph below. What is the average velocity during the time interval from t = 2 s to t = 6 s?
- 4.0 m/s
- 3.5 m/s
- 3.0 m/s
- 2.5 m/s
- 2.0 m/s
- 1.5 m/s
- 1.0 m/s
- 0.5 m/s
- 0.0 m/s
- -0.5 m/s
- -1.0 m/s
- -1.5 m/s
- -2.0 m/s
- -2.5 m/s
- -3.0 m/s
- -3.5 m/s
- -4.0 m/s
Consider the v-t graph below. What is the average velocity during the time interval from t = 2 s to t = 6 s?
- 4.0 m/s
- 3.5 m/s
- 3.0 m/s
- 2.5 m/s
- 2.0 m/s
- 1.5 m/s
- 1.0 m/s
- 0.5 m/s
- 0.0 m/s
- -0.5 m/s
- -1.0 m/s
- -1.5 m/s
- -2.0 m/s
- -2.5 m/s
- -3.0 m/s
- -3.5 m/s
- -4.0 m/s
Consider the v-t graph below. What is the average velocity during the time interval from t = 4 s to t = 6 s?
- 4.0 m/s
- 3.5 m/s
- 3.0 m/s
- 2.5 m/s
- 2.0 m/s
- 1.5 m/s
- 1.0 m/s
- 0.5 m/s
- 0.0 m/s
- -0.5 m/s
- -1.0 m/s
- -1.5 m/s
- -2.0 m/s
- -2.5 m/s
- -3.0 m/s
- -3.5 m/s
- -4.0 m/s
Consider the v-t graph below. What is the average velocity during the time interval from t = 4 s to t = 6 s?
- 4.0 m/s
- 3.5 m/s
- 3.0 m/s
- 2.5 m/s
- 2.0 m/s
- 1.5 m/s
- 1.0 m/s
- 0.5 m/s
- 0.0 m/s
- -0.5 m/s
- -1.0 m/s
- -1.5 m/s
- -2.0 m/s
- -2.5 m/s
- -3.0 m/s
- -3.5 m/s
- -4.0 m/s
Consider the v-t graph below. What is the average velocity during the time interval from t = 4 s to t = 6 s?
- 4.0 m/s
- 3.5 m/s
- 3.0 m/s
- 2.5 m/s
- 2.0 m/s
- 1.5 m/s
- 1.0 m/s
- 0.5 m/s
- 0.0 m/s
- -0.5 m/s
- -1.0 m/s
- -1.5 m/s
- -2.0 m/s
- -2.5 m/s
- -3.0 m/s
- -3.5 m/s
- -4.0 m/s
Consider the v-t graph below. What is the average velocity during the time interval from t = 2 s to t = 4 s?
- 4.0 m/s
- 3.5 m/s
- 3.0 m/s
- 2.5 m/s
- 2.0 m/s
- 1.5 m/s
- 1.0 m/s
- 0.5 m/s
- 0.0 m/s
- -0.5 m/s
- -1.0 m/s
- -1.5 m/s
- -2.0 m/s
- -2.5 m/s
- -3.0 m/s
- -3.5 m/s
- -4.0 m/s
Consider the v-t graph below. What is the average velocity during the time interval from t = 2 s to t = 4 s?
- 4.0 m/s
- 3.5 m/s
- 3.0 m/s
- 2.5 m/s
- 2.0 m/s
- 1.5 m/s
- 1.0 m/s
- 0.5 m/s
- 0.0 m/s
- -0.5 m/s
- -1.0 m/s
- -1.5 m/s
- -2.0 m/s
- -2.5 m/s
- -3.0 m/s
- -3.5 m/s
- -4.0 m/s
Consider the v-t graph below. What is the average velocity during the time interval from t = 2 s to t = 4 s?
- 4.0 m/s
- 3.5 m/s
- 3.0 m/s
- 2.5 m/s
- 2.0 m/s
- 1.5 m/s
- 1.0 m/s
- 0.5 m/s
- 0.0 m/s
- -0.5 m/s
- -1.0 m/s
- -1.5 m/s
- -2.0 m/s
- -2.5 m/s
- -3.0 m/s
- -3.5 m/s
- -4.0 m/s
Consider the v-t graph below. What is the average velocity during the time interval from t = 4 s to t = 6 s?
- 4.0 m/s
- 3.5 m/s
- 3.0 m/s
- 2.5 m/s
- 2.0 m/s
- 1.5 m/s
- 1.0 m/s
- 0.5 m/s
- 0.0 m/s
- -0.5 m/s
- -1.0 m/s
- -1.5 m/s
- -2.0 m/s
- -2.5 m/s
- -3.0 m/s
- -3.5 m/s
- -4.0 m/s
Consider the v-t graph below. What is the average velocity during the time interval from t = 4 s to t = 6 s?
- 4.0 m/s
- 3.5 m/s
- 3.0 m/s
- 2.5 m/s
- 2.0 m/s
- 1.5 m/s
- 1.0 m/s
- 0.5 m/s
- 0.0 m/s
- -0.5 m/s
- -1.0 m/s
- -1.5 m/s
- -2.0 m/s
- -2.5 m/s
- -3.0 m/s
- -3.5 m/s
- -4.0 m/s
Consider the v-t graph below. What is the average velocity during the time interval from t = 4 s to t = 6 s?
- 4.0 m/s
- 3.5 m/s
- 3.0 m/s
- 2.5 m/s
- 2.0 m/s
- 1.5 m/s
- 1.0 m/s
- 0.5 m/s
- 0.0 m/s
- -0.5 m/s
- -1.0 m/s
- -1.5 m/s
- -2.0 m/s
- -2.5 m/s
- -3.0 m/s
- -3.5 m/s
- -4.0 m/s
Consider the v-t graph below. What is the average velocity during the time interval from t = 4 s to t = 6 s?
- 4.0 m/s
- 3.5 m/s
- 3.0 m/s
- 2.5 m/s
- 2.0 m/s
- 1.5 m/s
- 1.0 m/s
- 0.5 m/s
- 0.0 m/s
- -0.5 m/s
- -1.0 m/s
- -1.5 m/s
- -2.0 m/s
- -2.5 m/s
- -3.0 m/s
- -3.5 m/s
- -4.0 m/s
Consider the v-t graph below. What is the average velocity during the time interval from t = 4 s to t = 6 s?
- 4.0 m/s
- 3.5 m/s
- 3.0 m/s
- 2.5 m/s
- 2.0 m/s
- 1.5 m/s
- 1.0 m/s
- 0.5 m/s
- 0.0 m/s
- -0.5 m/s
- -1.0 m/s
- -1.5 m/s
- -2.0 m/s
- -2.5 m/s
- -3.0 m/s
- -3.5 m/s
- -4.0 m/s
Consider the v-t graph below. What is the average velocity during the time interval from t = 4 s to t = 6 s?
- 4.0 m/s
- 3.5 m/s
- 3.0 m/s
- 2.5 m/s
- 2.0 m/s
- 1.5 m/s
- 1.0 m/s
- 0.5 m/s
- 0.0 m/s
- -0.5 m/s
- -1.0 m/s
- -1.5 m/s
- -2.0 m/s
- -2.5 m/s
- -3.0 m/s
- -3.5 m/s
- -4.0 m/s
Consider the v-t graph below. What is the average velocity during the time interval from t = 4 s to t = 8 s?
- 4.0 m/s
- 3.5 m/s
- 3.0 m/s
- 2.5 m/s
- 2.0 m/s
- 1.5 m/s
- 1.0 m/s
- 0.5 m/s
- 0.0 m/s
- -0.5 m/s
- -1.0 m/s
- -1.5 m/s
- -2.0 m/s
- -2.5 m/s
- -3.0 m/s
- -3.5 m/s
- -4.0 m/s
Consider the v-t graph below. What is the average velocity during the time interval from t = 4 s to t = 8 s?
- 4.0 m/s
- 3.5 m/s
- 3.0 m/s
- 2.5 m/s
- 2.0 m/s
- 1.5 m/s
- 1.0 m/s
- 0.5 m/s
- 0.0 m/s
- -0.5 m/s
- -1.0 m/s
- -1.5 m/s
- -2.0 m/s
- -2.5 m/s
- -3.0 m/s
- -3.5 m/s
- -4.0 m/s
Consider the v-t graph below. What is the average velocity during the time interval from t = 4 s to t = 8 s?
- 4.0 m/s
- 3.5 m/s
- 3.0 m/s
- 2.5 m/s
- 2.0 m/s
- 1.5 m/s
- 1.0 m/s
- 0.5 m/s
- 0.0 m/s
- -0.5 m/s
- -1.0 m/s
- -1.5 m/s
- -2.0 m/s
- -2.5 m/s
- -3.0 m/s
- -3.5 m/s
- -4.0 m/s
Consider the v-t graph below. What is the average velocity during the time interval from t = 4 s to t = 8 s?
- 4.0 m/s
- 3.5 m/s
- 3.0 m/s
- 2.5 m/s
- 2.0 m/s
- 1.5 m/s
- 1.0 m/s
- 0.5 m/s
- 0.0 m/s
- -0.5 m/s
- -1.0 m/s
- -1.5 m/s
- -2.0 m/s
- -2.5 m/s
- -3.0 m/s
- -3.5 m/s
- -4.0 m/s
Consider the v-t graph below. What is the average velocity during the time interval from t = 4 s to t = 8 s?
- 4.0 m/s
- 3.5 m/s
- 3.0 m/s
- 2.5 m/s
- 2.0 m/s
- 1.5 m/s
- 1.0 m/s
- 0.5 m/s
- 0.0 m/s
- -0.5 m/s
- -1.0 m/s
- -1.5 m/s
- -2.0 m/s
- -2.5 m/s
- -3.0 m/s
- -3.5 m/s
- -4.0 m/s
Consider the v-t graph below. What is the average velocity during the time interval from t = 4 s to t = 8 s?
- 4.0 m/s
- 3.5 m/s
- 3.0 m/s
- 2.5 m/s
- 2.0 m/s
- 1.5 m/s
- 1.0 m/s
- 0.5 m/s
- 0.0 m/s
- -0.5 m/s
- -1.0 m/s
- -1.5 m/s
- -2.0 m/s
- -2.5 m/s
- -3.0 m/s
- -3.5 m/s
- -4.0 m/s
Consider the v-t graph below. What is the average velocity during the time interval from t = 4 s to t = 8 s?
- 4.0 m/s
- 3.5 m/s
- 3.0 m/s
- 2.5 m/s
- 2.0 m/s
- 1.5 m/s
- 1.0 m/s
- 0.5 m/s
- 0.0 m/s
- -0.5 m/s
- -1.0 m/s
- -1.5 m/s
- -2.0 m/s
- -2.5 m/s
- -3.0 m/s
- -3.5 m/s
- -4.0 m/s
Consider the v-t graph below. What is the average velocity during the time interval from t = 4 s to t = 8 s?
- 4.0 m/s
- 3.5 m/s
- 3.0 m/s
- 2.5 m/s
- 2.0 m/s
- 1.5 m/s
- 1.0 m/s
- 0.5 m/s
- 0.0 m/s
- -0.5 m/s
- -1.0 m/s
- -1.5 m/s
- -2.0 m/s
- -2.5 m/s
- -3.0 m/s
- -3.5 m/s
- -4.0 m/s
Consider the v-t graph below. What is the average velocity during the time interval from t = 6 s to t = 8 s?
- 4.0 m/s
- 3.5 m/s
- 3.0 m/s
- 2.5 m/s
- 2.0 m/s
- 1.5 m/s
- 1.0 m/s
- 0.5 m/s
- 0.0 m/s
- -0.5 m/s
- -1.0 m/s
- -1.5 m/s
- -2.0 m/s
- -2.5 m/s
- -3.0 m/s
- -3.5 m/s
- -4.0 m/s
Consider the v-t graph below. What is the average velocity during the time interval from t = 6 s to t = 8 s?
- 4.0 m/s
- 3.5 m/s
- 3.0 m/s
- 2.5 m/s
- 2.0 m/s
- 1.5 m/s
- 1.0 m/s
- 0.5 m/s
- 0.0 m/s
- -0.5 m/s
- -1.0 m/s
- -1.5 m/s
- -2.0 m/s
- -2.5 m/s
- -3.0 m/s
- -3.5 m/s
- -4.0 m/s
Consider the v-t graph below. What is the average velocity during the time interval from t = 6 s to t = 8 s?
- 4.0 m/s
- 3.5 m/s
- 3.0 m/s
- 2.5 m/s
- 2.0 m/s
- 1.5 m/s
- 1.0 m/s
- 0.5 m/s
- 0.0 m/s
- -0.5 m/s
- -1.0 m/s
- -1.5 m/s
- -2.0 m/s
- -2.5 m/s
- -3.0 m/s
- -3.5 m/s
- -4.0 m/s
Consider the v-t graph below. What is the average velocity during the time interval from t = 6 s to t = 8 s?
- 4.0 m/s
- 3.5 m/s
- 3.0 m/s
- 2.5 m/s
- 2.0 m/s
- 1.5 m/s
- 1.0 m/s
- 0.5 m/s
- 0.0 m/s
- -0.5 m/s
- -1.0 m/s
- -1.5 m/s
- -2.0 m/s
- -2.5 m/s
- -3.0 m/s
- -3.5 m/s
- -4.0 m/s
Consider the v-t graph below. What is the average velocity during the time interval from t = 6 s to t = 8 s?
- 4.0 m/s
- 3.5 m/s
- 3.0 m/s
- 2.5 m/s
- 2.0 m/s
- 1.5 m/s
- 1.0 m/s
- 0.5 m/s
- 0.0 m/s
- -0.5 m/s
- -1.0 m/s
- -1.5 m/s
- -2.0 m/s
- -2.5 m/s
- -3.0 m/s
- -3.5 m/s
- -4.0 m/s
Consider the v-t graph below. What is the average velocity during the time interval from t = 6 s to t = 8 s?
- 4.0 m/s
- 3.5 m/s
- 3.0 m/s
- 2.5 m/s
- 2.0 m/s
- 1.5 m/s
- 1.0 m/s
- 0.5 m/s
- 0.0 m/s
- -0.5 m/s
- -1.0 m/s
- -1.5 m/s
- -2.0 m/s
- -2.5 m/s
- -3.0 m/s
- -3.5 m/s
- -4.0 m/s
Consider the v-t graph below. What is the average velocity during the time interval from t = 6 s to t = 8 s?
- 4.0 m/s
- 3.5 m/s
- 3.0 m/s
- 2.5 m/s
- 2.0 m/s
- 1.5 m/s
- 1.0 m/s
- 0.5 m/s
- 0.0 m/s
- -0.5 m/s
- -1.0 m/s
- -1.5 m/s
- -2.0 m/s
- -2.5 m/s
- -3.0 m/s
- -3.5 m/s
- -4.0 m/s
Consider the v-t graph below. What is the average velocity during the time interval from t = 6 s to t = 8 s?
- 4.0 m/s
- 3.5 m/s
- 3.0 m/s
- 2.5 m/s
- 2.0 m/s
- 1.5 m/s
- 1.0 m/s
- 0.5 m/s
- 0.0 m/s
- -0.5 m/s
- -1.0 m/s
- -1.5 m/s
- -2.0 m/s
- -2.5 m/s
- -3.0 m/s
- -3.5 m/s
- -4.0 m/s
Consider the v-t graph below. What is the average velocity during the time interval from t = 6 s to t = 8 s?
- 4.0 m/s
- 3.5 m/s
- 3.0 m/s
- 2.5 m/s
- 2.0 m/s
- 1.5 m/s
- 1.0 m/s
- 0.5 m/s
- 0.0 m/s
- -0.5 m/s
- -1.0 m/s
- -1.5 m/s
- -2.0 m/s
- -2.5 m/s
- -3.0 m/s
- -3.5 m/s
- -4.0 m/s
Consider the v-t graph below. What is the average velocity during the time interval from t = 6 s to t = 8 s?
- 4.0 m/s
- 3.5 m/s
- 3.0 m/s
- 2.5 m/s
- 2.0 m/s
- 1.5 m/s
- 1.0 m/s
- 0.5 m/s
- 0.0 m/s
- -0.5 m/s
- -1.0 m/s
- -1.5 m/s
- -2.0 m/s
- -2.5 m/s
- -3.0 m/s
- -3.5 m/s
- -4.0 m/s
Consider the v-t graph below. What is the average velocity during the time interval from t = 6 s to t = 8 s?
- 4.0 m/s
- 3.5 m/s
- 3.0 m/s
- 2.5 m/s
- 2.0 m/s
- 1.5 m/s
- 1.0 m/s
- 0.5 m/s
- 0.0 m/s
- -0.5 m/s
- -1.0 m/s
- -1.5 m/s
- -2.0 m/s
- -2.5 m/s
- -3.0 m/s
- -3.5 m/s
- -4.0 m/s
Consider the v-t graph below. What is the average velocity during the time interval from t = 6 s to t = 8 s?
- 4.0 m/s
- 3.5 m/s
- 3.0 m/s
- 2.5 m/s
- 2.0 m/s
- 1.5 m/s
- 1.0 m/s
- 0.5 m/s
- 0.0 m/s
- -0.5 m/s
- -1.0 m/s
- -1.5 m/s
- -2.0 m/s
- -2.5 m/s
- -3.0 m/s
- -3.5 m/s
- -4.0 m/s
Consider the v-t graph below. What is the average velocity during the time interval from t = 6 s to t = 8 s?
- 4.0 m/s
- 3.5 m/s
- 3.0 m/s
- 2.5 m/s
- 2.0 m/s
- 1.5 m/s
- 1.0 m/s
- 0.5 m/s
- 0.0 m/s
- -0.5 m/s
- -1.0 m/s
- -1.5 m/s
- -2.0 m/s
- -2.5 m/s
- -3.0 m/s
- -3.5 m/s
- -4.0 m/s
Consider the v-t graph below. What is the average velocity during the time interval from t = 6 s to t = 8 s?
- 4.0 m/s
- 3.5 m/s
- 3.0 m/s
- 2.5 m/s
- 2.0 m/s
- 1.5 m/s
- 1.0 m/s
- 0.5 m/s
- 0.0 m/s
- -0.5 m/s
- -1.0 m/s
- -1.5 m/s
- -2.0 m/s
- -2.5 m/s
- -3.0 m/s
- -3.5 m/s
- -4.0 m/s
Consider the v-t graph below. What is the average velocity during the time interval from t = 6 s to t = 8 s?
- 4.0 m/s
- 3.5 m/s
- 3.0 m/s
- 2.5 m/s
- 2.0 m/s
- 1.5 m/s
- 1.0 m/s
- 0.5 m/s
- 0.0 m/s
- -0.5 m/s
- -1.0 m/s
- -1.5 m/s
- -2.0 m/s
- -2.5 m/s
- -3.0 m/s
- -3.5 m/s
- -4.0 m/s
Consider the v-t graph below. What is the average velocity during the time interval from t = 6 s to t = 8 s?
- 4.0 m/s
- 3.5 m/s
- 3.0 m/s
- 2.5 m/s
- 2.0 m/s
- 1.5 m/s
- 1.0 m/s
- 0.5 m/s
- 0.0 m/s
- -0.5 m/s
- -1.0 m/s
- -1.5 m/s
- -2.0 m/s
- -2.5 m/s
- -3.0 m/s
- -3.5 m/s
- -4.0 m/s
Consider the v-t graph below. What is the average velocity during the time interval from t = 6 s to t = 8 s?
- 4.0 m/s
- 3.5 m/s
- 3.0 m/s
- 2.5 m/s
- 2.0 m/s
- 1.5 m/s
- 1.0 m/s
- 0.5 m/s
- 0.0 m/s
- -0.5 m/s
- -1.0 m/s
- -1.5 m/s
- -2.0 m/s
- -2.5 m/s
- -3.0 m/s
- -3.5 m/s
- -4.0 m/s
Consider the v-t graph below. What is the average velocity during the time interval from t = 4 s to t = 8 s?
- 4.0 m/s
- 3.5 m/s
- 3.0 m/s
- 2.5 m/s
- 2.0 m/s
- 1.5 m/s
- 1.0 m/s
- 0.5 m/s
- 0.0 m/s
- -0.5 m/s
- -1.0 m/s
- -1.5 m/s
- -2.0 m/s
- -2.5 m/s
- -3.0 m/s
- -3.5 m/s
- -4.0 m/s
Consider the v-t graph below. What is the average velocity during the time interval from t = 4 s to t = 8 s?
- 4.0 m/s
- 3.5 m/s
- 3.0 m/s
- 2.5 m/s
- 2.0 m/s
- 1.5 m/s
- 1.0 m/s
- 0.5 m/s
- 0.0 m/s
- -0.5 m/s
- -1.0 m/s
- -1.5 m/s
- -2.0 m/s
- -2.5 m/s
- -3.0 m/s
- -3.5 m/s
- -4.0 m/s
Consider the v-t graph below. What is the average velocity during the time interval from t = 4 s to t = 8 s?
- 4.0 m/s
- 3.5 m/s
- 3.0 m/s
- 2.5 m/s
- 2.0 m/s
- 1.5 m/s
- 1.0 m/s
- 0.5 m/s
- 0.0 m/s
- -0.5 m/s
- -1.0 m/s
- -1.5 m/s
- -2.0 m/s
- -2.5 m/s
- -3.0 m/s
- -3.5 m/s
- -4.0 m/s
Consider the v-t graph below. What is the average velocity during the time interval from t = 6 s to t = 8 s?
- 4.0 m/s
- 3.5 m/s
- 3.0 m/s
- 2.5 m/s
- 2.0 m/s
- 1.5 m/s
- 1.0 m/s
- 0.5 m/s
- 0.0 m/s
- -0.5 m/s
- -1.0 m/s
- -1.5 m/s
- -2.0 m/s
- -2.5 m/s
- -3.0 m/s
- -3.5 m/s
- -4.0 m/s
Consider the v-t graph below. What is the average velocity during the time interval from t = 6 s to t = 8 s?
- 4.0 m/s
- 3.5 m/s
- 3.0 m/s
- 2.5 m/s
- 2.0 m/s
- 1.5 m/s
- 1.0 m/s
- 0.5 m/s
- 0.0 m/s
- -0.5 m/s
- -1.0 m/s
- -1.5 m/s
- -2.0 m/s
- -2.5 m/s
- -3.0 m/s
- -3.5 m/s
- -4.0 m/s
Consider the v-t graph below. What is the average velocity during the time interval from t = 6 s to t = 8 s?
- 4.0 m/s
- 3.5 m/s
- 3.0 m/s
- 2.5 m/s
- 2.0 m/s
- 1.5 m/s
- 1.0 m/s
- 0.5 m/s
- 0.0 m/s
- -0.5 m/s
- -1.0 m/s
- -1.5 m/s
- -2.0 m/s
- -2.5 m/s
- -3.0 m/s
- -3.5 m/s
- -4.0 m/s
Consider the v-t graph below. What is the average velocity during the time interval from t = 6 s to t = 8 s?
- 4.0 m/s
- 3.5 m/s
- 3.0 m/s
- 2.5 m/s
- 2.0 m/s
- 1.5 m/s
- 1.0 m/s
- 0.5 m/s
- 0.0 m/s
- -0.5 m/s
- -1.0 m/s
- -1.5 m/s
- -2.0 m/s
- -2.5 m/s
- -3.0 m/s
- -3.5 m/s
- -4.0 m/s
Consider the v-t graph below. What is the average velocity during the time interval from t = 6 s to t = 8 s?
- 4.0 m/s
- 3.5 m/s
- 3.0 m/s
- 2.5 m/s
- 2.0 m/s
- 1.5 m/s
- 1.0 m/s
- 0.5 m/s
- 0.0 m/s
- -0.5 m/s
- -1.0 m/s
- -1.5 m/s
- -2.0 m/s
- -2.5 m/s
- -3.0 m/s
- -3.5 m/s
- -4.0 m/s
Consider the v-t graph below. What is the average velocity during the time interval from t = 6 s to t = 8 s?
- 4.0 m/s
- 3.5 m/s
- 3.0 m/s
- 2.5 m/s
- 2.0 m/s
- 1.5 m/s
- 1.0 m/s
- 0.5 m/s
- 0.0 m/s
- -0.5 m/s
- -1.0 m/s
- -1.5 m/s
- -2.0 m/s
- -2.5 m/s
- -3.0 m/s
- -3.5 m/s
- -4.0 m/s
Consider the v-t graph below. What is the average velocity during the entire time interval from t = 0 s to t = 8 s?
- 4.0 m/s
- 3.5 m/s
- 3.0 m/s
- 2.5 m/s
- 2.0 m/s
- 1.5 m/s
- 1.0 m/s
- 0.5 m/s
- 0.0 m/s
- -0.5 m/s
- -1.0 m/s
- -1.5 m/s
- -2.0 m/s
- -2.5 m/s
- -3.0 m/s
- -3.5 m/s
- -4.0 m/s
Consider the v-t graph below. What is the average velocity during the entire time interval from t = 0 s to t = 8 s?
- 4.0 m/s
- 3.5 m/s
- 3.0 m/s
- 2.5 m/s
- 2.0 m/s
- 1.5 m/s
- 1.0 m/s
- 0.5 m/s
- 0.0 m/s
- -0.5 m/s
- -1.0 m/s
- -1.5 m/s
- -2.0 m/s
- -2.5 m/s
- -3.0 m/s
- -3.5 m/s
- -4.0 m/s
Consider the v-t graph below. What is the average velocity during the entire time interval from t = 0 s to t = 8 s?
- 4.0 m/s
- 3.5 m/s
- 3.0 m/s
- 2.5 m/s
- 2.0 m/s
- 1.5 m/s
- 1.0 m/s
- 0.5 m/s
- 0.0 m/s
- -0.5 m/s
- -1.0 m/s
- -1.5 m/s
- -2.0 m/s
- -2.5 m/s
- -3.0 m/s
- -3.5 m/s
- -4.0 m/s
Consider the v-t graph below. What is the average velocity during the entire time interval from t = 0 s to t = 8 s?
- 4.0 m/s
- 3.5 m/s
- 3.0 m/s
- 2.5 m/s
- 2.0 m/s
- 1.5 m/s
- 1.0 m/s
- 0.5 m/s
- 0.0 m/s
- -0.5 m/s
- -1.0 m/s
- -1.5 m/s
- -2.0 m/s
- -2.5 m/s
- -3.0 m/s
- -3.5 m/s
- -4.0 m/s
Consider the v-t graph below. What is the average velocity during the entire time interval from t = 0 s to t = 8 s?
- 4.0 m/s
- 3.5 m/s
- 3.0 m/s
- 2.5 m/s
- 2.0 m/s
- 1.5 m/s
- 1.0 m/s
- 0.5 m/s
- 0.0 m/s
- -0.5 m/s
- -1.0 m/s
- -1.5 m/s
- -2.0 m/s
- -2.5 m/s
- -3.0 m/s
- -3.5 m/s
- -4.0 m/s
Consider the v-t graph below. What is the average velocity during the entire time interval from t = 0 s to t = 8 s?
- 4.0 m/s
- 3.5 m/s
- 3.0 m/s
- 2.5 m/s
- 2.0 m/s
- 1.5 m/s
- 1.0 m/s
- 0.5 m/s
- 0.0 m/s
- -0.5 m/s
- -1.0 m/s
- -1.5 m/s
- -2.0 m/s
- -2.5 m/s
- -3.0 m/s
- -3.5 m/s
- -4.0 m/s
Consider the v-t graph below. What is the average velocity during the entire time interval from t = 0 s to t = 8 s?
- 4.0 m/s
- 3.5 m/s
- 3.0 m/s
- 2.5 m/s
- 2.0 m/s
- 1.5 m/s
- 1.0 m/s
- 0.5 m/s
- 0.0 m/s
- -0.5 m/s
- -1.0 m/s
- -1.5 m/s
- -2.0 m/s
- -2.5 m/s
- -3.0 m/s
- -3.5 m/s
- -4.0 m/s
Consider the v-t graph below. What is the average velocity during the entire time interval from t = 0 s to t = 8 s?
- 4.0 m/s
- 3.5 m/s
- 3.0 m/s
- 2.5 m/s
- 2.0 m/s
- 1.5 m/s
- 1.0 m/s
- 0.5 m/s
- 0.0 m/s
- -0.5 m/s
- -1.0 m/s
- -1.5 m/s
- -2.0 m/s
- -2.5 m/s
- -3.0 m/s
- -3.5 m/s
- -4.0 m/s
Consider the v-t graph below. What is the average velocity during the entire time interval from t = 0 s to t = 8 s?
- 4.0 m/s
- 3.5 m/s
- 3.0 m/s
- 2.5 m/s
- 2.0 m/s
- 1.5 m/s
- 1.0 m/s
- 0.5 m/s
- 0.0 m/s
- -0.5 m/s
- -1.0 m/s
- -1.5 m/s
- -2.0 m/s
- -2.5 m/s
- -3.0 m/s
- -3.5 m/s
- -4.0 m/s
Consider the v-t graph below. What is the average velocity during the entire time interval from t = 0 s to t = 8 s?
- 4.0 m/s
- 3.5 m/s
- 3.0 m/s
- 2.5 m/s
- 2.0 m/s
- 1.5 m/s
- 1.0 m/s
- 0.5 m/s
- 0.0 m/s
- -0.5 m/s
- -1.0 m/s
- -1.5 m/s
- -2.0 m/s
- -2.5 m/s
- -3.0 m/s
- -3.5 m/s
- -4.0 m/s
Consider the v-t graph below. What is the average velocity during the entire time interval from t = 0 s to t = 8 s?
- 4.0 m/s
- 3.5 m/s
- 3.0 m/s
- 2.5 m/s
- 2.0 m/s
- 1.5 m/s
- 1.0 m/s
- 0.5 m/s
- 0.0 m/s
- -0.5 m/s
- -1.0 m/s
- -1.5 m/s
- -2.0 m/s
- -2.5 m/s
- -3.0 m/s
- -3.5 m/s
- -4.0 m/s
Consider the v-t graph below. What is the average velocity during the entire time interval from t = 0 s to t = 8 s?
- 4.0 m/s
- 3.5 m/s
- 3.0 m/s
- 2.5 m/s
- 2.0 m/s
- 1.5 m/s
- 1.0 m/s
- 0.5 m/s
- 0.0 m/s
- -0.5 m/s
- -1.0 m/s
- -1.5 m/s
- -2.0 m/s
- -2.5 m/s
- -3.0 m/s
- -3.5 m/s
- -4.0 m/s
Consider the v-t graph below. What is the average velocity during the entire time interval from t = 0 s to t = 8 s?
- 4.0 m/s
- 3.5 m/s
- 3.0 m/s
- 2.5 m/s
- 2.0 m/s
- 1.5 m/s
- 1.0 m/s
- 0.5 m/s
- 0.0 m/s
- -0.5 m/s
- -1.0 m/s
- -1.5 m/s
- -2.0 m/s
- -2.5 m/s
- -3.0 m/s
- -3.5 m/s
- -4.0 m/s
Consider the v-t graph below. What is the average velocity during the entire time interval from t = 0 s to t = 8 s?
- 4.0 m/s
- 3.5 m/s
- 3.0 m/s
- 2.5 m/s
- 2.0 m/s
- 1.5 m/s
- 1.0 m/s
- 0.5 m/s
- 0.0 m/s
- -0.5 m/s
- -1.0 m/s
- -1.5 m/s
- -2.0 m/s
- -2.5 m/s
- -3.0 m/s
- -3.5 m/s
- -4.0 m/s
Consider the v-t graph below. What is the average velocity during the entire time interval from t = 0 s to t = 8 s?
- 4.0 m/s
- 3.5 m/s
- 3.0 m/s
- 2.5 m/s
- 2.0 m/s
- 1.5 m/s
- 1.0 m/s
- 0.5 m/s
- 0.0 m/s
- -0.5 m/s
- -1.0 m/s
- -1.5 m/s
- -2.0 m/s
- -2.5 m/s
- -3.0 m/s
- -3.5 m/s
- -4.0 m/s
Consider the v-t graph below. What is the average velocity during the entire time interval from t = 0 s to t = 8 s?
- 4.0 m/s
- 3.5 m/s
- 3.0 m/s
- 2.5 m/s
- 2.0 m/s
- 1.5 m/s
- 1.0 m/s
- 0.5 m/s
- 0.0 m/s
- -0.5 m/s
- -1.0 m/s
- -1.5 m/s
- -2.0 m/s
- -2.5 m/s
- -3.0 m/s
- -3.5 m/s
- -4.0 m/s
Consider the v-t graph below. What is the average velocity during the entire time interval from t = 0 s to t = 8 s?
- 4.0 m/s
- 3.5 m/s
- 3.0 m/s
- 2.5 m/s
- 2.0 m/s
- 1.5 m/s
- 1.0 m/s
- 0.5 m/s
- 0.0 m/s
- -0.5 m/s
- -1.0 m/s
- -1.5 m/s
- -2.0 m/s
- -2.5 m/s
- -3.0 m/s
- -3.5 m/s
- -4.0 m/s
Consider the v-t graph below. What is the average velocity during the entire time interval from t = 0 s to t = 8 s?
- 4.0 m/s
- 3.5 m/s
- 3.0 m/s
- 2.5 m/s
- 2.0 m/s
- 1.5 m/s
- 1.0 m/s
- 0.5 m/s
- 0.0 m/s
- -0.5 m/s
- -1.0 m/s
- -1.5 m/s
- -2.0 m/s
- -2.5 m/s
- -3.0 m/s
- -3.5 m/s
- -4.0 m/s
Consider the v-t graph below. What is the average velocity during the entire time interval from t = 0 s to t = 8 s?
- 4.0 m/s
- 3.5 m/s
- 3.0 m/s
- 2.5 m/s
- 2.0 m/s
- 1.5 m/s
- 1.0 m/s
- 0.5 m/s
- 0.0 m/s
- -0.5 m/s
- -1.0 m/s
- -1.5 m/s
- -2.0 m/s
- -2.5 m/s
- -3.0 m/s
- -3.5 m/s
- -4.0 m/s
Consider the v-t graph below. What is the average velocity during the entire time interval from t = 0 s to t = 8 s?
- 4.0 m/s
- 3.5 m/s
- 3.0 m/s
- 2.5 m/s
- 2.0 m/s
- 1.5 m/s
- 1.0 m/s
- 0.5 m/s
- 0.0 m/s
- -0.5 m/s
- -1.0 m/s
- -1.5 m/s
- -2.0 m/s
- -2.5 m/s
- -3.0 m/s
- -3.5 m/s
- -4.0 m/s
Consider the v-t graph below. What is the average velocity during the entire time interval from t = 0 s to t = 8 s?
- 4.0 m/s
- 3.5 m/s
- 3.0 m/s
- 2.5 m/s
- 2.0 m/s
- 1.5 m/s
- 1.0 m/s
- 0.5 m/s
- 0.0 m/s
- -0.5 m/s
- -1.0 m/s
- -1.5 m/s
- -2.0 m/s
- -2.5 m/s
- -3.0 m/s
- -3.5 m/s
- -4.0 m/s
Consider the v-t graph below. What is the average velocity during the entire time interval from t = 0 s to t = 8 s?
- 4.0 m/s
- 3.5 m/s
- 3.0 m/s
- 2.5 m/s
- 2.0 m/s
- 1.5 m/s
- 1.0 m/s
- 0.5 m/s
- 0.0 m/s
- -0.5 m/s
- -1.0 m/s
- -1.5 m/s
- -2.0 m/s
- -2.5 m/s
- -3.0 m/s
- -3.5 m/s
- -4.0 m/s
Consider the v-t graph below. What is the average velocity during the entire time interval from t = 0 s to t = 8 s?
- 4.0 m/s
- 3.5 m/s
- 3.0 m/s
- 2.5 m/s
- 2.0 m/s
- 1.5 m/s
- 1.0 m/s
- 0.5 m/s
- 0.0 m/s
- -0.5 m/s
- -1.0 m/s
- -1.5 m/s
- -2.0 m/s
- -2.5 m/s
- -3.0 m/s
- -3.5 m/s
- -4.0 m/s
Consider the v-t graph below. What is the average velocity during the entire time interval from t = 0 s to t = 8 s?
- 4.0 m/s
- 3.5 m/s
- 3.0 m/s
- 2.5 m/s
- 2.0 m/s
- 1.5 m/s
- 1.0 m/s
- 0.5 m/s
- 0.0 m/s
- -0.5 m/s
- -1.0 m/s
- -1.5 m/s
- -2.0 m/s
- -2.5 m/s
- -3.0 m/s
- -3.5 m/s
- -4.0 m/s
Consider the v-t graph below. What is the average velocity during the entire time interval from t = 0 s to t = 8 s?
- 4.0 m/s
- 3.5 m/s
- 3.0 m/s
- 2.5 m/s
- 2.0 m/s
- 1.5 m/s
- 1.0 m/s
- 0.5 m/s
- 0.0 m/s
- -0.5 m/s
- -1.0 m/s
- -1.5 m/s
- -2.0 m/s
- -2.5 m/s
- -3.0 m/s
- -3.5 m/s
- -4.0 m/s
Consider the v-t graph below. What is the average velocity during the entire time interval from t = 0 s to t = 8 s?
- 4.0 m/s
- 3.5 m/s
- 3.0 m/s
- 2.5 m/s
- 2.0 m/s
- 1.5 m/s
- 1.0 m/s
- 0.5 m/s
- 0.0 m/s
- -0.5 m/s
- -1.0 m/s
- -1.5 m/s
- -2.0 m/s
- -2.5 m/s
- -3.0 m/s
- -3.5 m/s
- -4.0 m/s
Consider the v-t graph below. What is the average velocity during the entire time interval from t = 0 s to t = 8 s?
- 4.0 m/s
- 3.5 m/s
- 3.0 m/s
- 2.5 m/s
- 2.0 m/s
- 1.5 m/s
- 1.0 m/s
- 0.5 m/s
- 0.0 m/s
- -0.5 m/s
- -1.0 m/s
- -1.5 m/s
- -2.0 m/s
- -2.5 m/s
- -3.0 m/s
- -3.5 m/s
- -4.0 m/s
Consider the v-t graph below. What is the average velocity during the entire time interval from t = 0 s to t = 8 s?
- 4.0 m/s
- 3.5 m/s
- 3.0 m/s
- 2.5 m/s
- 2.0 m/s
- 1.5 m/s
- 1.0 m/s
- 0.5 m/s
- 0.0 m/s
- -0.5 m/s
- -1.0 m/s
- -1.5 m/s
- -2.0 m/s
- -2.5 m/s
- -3.0 m/s
- -3.5 m/s
- -4.0 m/s
Consider the v-t graph below. What is the average velocity during the entire time interval from t = 0 s to t = 8 s?
- 4.0 m/s
- 3.5 m/s
- 3.0 m/s
- 2.5 m/s
- 2.0 m/s
- 1.5 m/s
- 1.0 m/s
- 0.5 m/s
- 0.0 m/s
- -0.5 m/s
- -1.0 m/s
- -1.5 m/s
- -2.0 m/s
- -2.5 m/s
- -3.0 m/s
- -3.5 m/s
- -4.0 m/s
Consider the v-t graph below. What is the average velocity during the entire time interval from t = 0 s to t = 8 s?
- 4.0 m/s
- 3.5 m/s
- 3.0 m/s
- 2.5 m/s
- 2.0 m/s
- 1.5 m/s
- 1.0 m/s
- 0.5 m/s
- 0.0 m/s
- -0.5 m/s
- -1.0 m/s
- -1.5 m/s
- -2.0 m/s
- -2.5 m/s
- -3.0 m/s
- -3.5 m/s
- -4.0 m/s
Consider the v-t graph below. What is the acceleration during the time interval from t = 0 s to t = 2 s?
- 3.0 m/s2
- 2.0 m/s2
- 1.0 m/s2
- 0.0 m/s2
- -1.0 m/s2
- -2.0 m/s2
- -3.0 m/s2
Consider the v-t graph below. What is the acceleration during the time interval from t = 0 s to t = 2 s?
- 3.0 m/s2
- 2.0 m/s2
- 1.0 m/s2
- 0.0 m/s2
- -1.0 m/s2
- -2.0 m/s2
- -3.0 m/s2
Consider the v-t graph below. What is the acceleration during the time interval from t = 0 s to t = 2 s?
- 3.0 m/s2
- 2.0 m/s2
- 1.0 m/s2
- 0.0 m/s2
- -1.0 m/s2
- -2.0 m/s2
- -3.0 m/s2
Consider the v-t graph below. What is the acceleration during the time interval from t = 0 s to t = 2 s?
- 3.0 m/s2
- 2.0 m/s2
- 1.0 m/s2
- 0.0 m/s2
- -1.0 m/s2
- -2.0 m/s2
- -3.0 m/s2
Consider the v-t graph below. What is the acceleration during the time interval from t = 0 s to t = 2 s?
- 3.0 m/s2
- 2.0 m/s2
- 1.0 m/s2
- 0.0 m/s2
- -1.0 m/s2
- -2.0 m/s2
- -3.0 m/s2
Consider the v-t graph below. What is the acceleration during the time interval from t = 0 s to t = 2 s?
- 3.0 m/s2
- 2.0 m/s2
- 1.0 m/s2
- 0.0 m/s2
- -1.0 m/s2
- -2.0 m/s2
- -3.0 m/s2
Consider the v-t graph below. What is the acceleration during the time interval from t = 0 s to t = 2 s?
- 3.0 m/s2
- 2.0 m/s2
- 1.0 m/s2
- 0.0 m/s2
- -1.0 m/s2
- -2.0 m/s2
- -3.0 m/s2
Consider the v-t graph below. What is the acceleration during the time interval from t = 0 s to t = 2 s?
- 3.0 m/s2
- 2.0 m/s2
- 1.0 m/s2
- 0.0 m/s2
- -1.0 m/s2
- -2.0 m/s2
- -3.0 m/s2
Consider the v-t graph below. What is the acceleration during the time interval from t = 0 s to t = 4 s?
- 3.0 m/s2
- 2.0 m/s2
- 1.0 m/s2
- 0.0 m/s2
- -1.0 m/s2
- -2.0 m/s2
- -3.0 m/s2
Consider the v-t graph below. What is the acceleration during the time interval from t = 0 s to t = 4 s?
- 3.0 m/s2
- 2.0 m/s2
- 1.0 m/s2
- 0.0 m/s2
- -1.0 m/s2
- -2.0 m/s2
- -3.0 m/s2
Consider the v-t graph below. What is the acceleration during the time interval from t = 0 s to t = 2 s?
- 3.0 m/s2
- 2.0 m/s2
- 1.0 m/s2
- 0.0 m/s2
- -1.0 m/s2
- -2.0 m/s2
- -3.0 m/s2
Consider the v-t graph below. What is the acceleration during the time interval from t = 0 s to t = 2 s?
- 3.0 m/s2
- 2.0 m/s2
- 1.0 m/s2
- 0.0 m/s2
- -1.0 m/s2
- -2.0 m/s2
- -3.0 m/s2
Consider the v-t graph below. What is the acceleration during the time interval from t = 0 s to t = 2 s?
- 3.0 m/s2
- 2.0 m/s2
- 1.0 m/s2
- 0.0 m/s2
- -1.0 m/s2
- -2.0 m/s2
- -3.0 m/s2
Consider the v-t graph below. What is the acceleration during the time interval from t = 0 s to t = 2 s?
- 3.0 m/s2
- 2.0 m/s2
- 1.0 m/s2
- 0.0 m/s2
- -1.0 m/s2
- -2.0 m/s2
- -3.0 m/s2
Consider the v-t graph below. What is the acceleration during the time interval from t = 0 s to t = 2 s?
- 3.0 m/s2
- 2.0 m/s2
- 1.0 m/s2
- 0.0 m/s2
- -1.0 m/s2
- -2.0 m/s2
- -3.0 m/s2
Consider the v-t graph below. What is the acceleration during the time interval from t = 0 s to t = 2 s?
- 3.0 m/s2
- 2.0 m/s2
- 1.0 m/s2
- 0.0 m/s2
- -1.0 m/s2
- -2.0 m/s2
- -3.0 m/s2
Consider the v-t graph below. What is the acceleration during the time interval from t = 0 s to t = 2 s?
- 3.0 m/s2
- 2.0 m/s2
- 1.0 m/s2
- 0.0 m/s2
- -1.0 m/s2
- -2.0 m/s2
- -3.0 m/s2
Consider the v-t graph below. What is the acceleration during the time interval from t = 0 s to t = 2 s?
- 3.0 m/s2
- 2.0 m/s2
- 1.0 m/s2
- 0.0 m/s2
- -1.0 m/s2
- -2.0 m/s2
- -3.0 m/s2
Consider the v-t graph below. What is the acceleration during the time interval from t = 0 s to t = 2 s?
- 3.0 m/s2
- 2.0 m/s2
- 1.0 m/s2
- 0.0 m/s2
- -1.0 m/s2
- -2.0 m/s2
- -3.0 m/s2
Consider the v-t graph below. What is the acceleration during the time interval from t = 0 s to t = 2 s?
- 3.0 m/s2
- 2.0 m/s2
- 1.0 m/s2
- 0.0 m/s2
- -1.0 m/s2
- -2.0 m/s2
- -3.0 m/s2
Consider the v-t graph below. What is the acceleration during the time interval from t = 0 s to t = 2 s?
- 3.0 m/s2
- 2.0 m/s2
- 1.0 m/s2
- 0.0 m/s2
- -1.0 m/s2
- -2.0 m/s2
- -3.0 m/s2
Consider the v-t graph below. What is the acceleration during the time interval from t = 0 s to t = 2 s?
- 3.0 m/s2
- 2.0 m/s2
- 1.0 m/s2
- 0.0 m/s2
- -1.0 m/s2
- -2.0 m/s2
- -3.0 m/s2
Consider the v-t graph below. What is the acceleration during the time interval from t = 0 s to t = 4 s?
- 3.0 m/s2
- 2.0 m/s2
- 1.0 m/s2
- 0.0 m/s2
- -1.0 m/s2
- -2.0 m/s2
- -3.0 m/s2
Consider the v-t graph below. What is the acceleration during the time interval from t = 0 s to t = 4 s?
- 3.0 m/s2
- 2.0 m/s2
- 1.0 m/s2
- 0.0 m/s2
- -1.0 m/s2
- -2.0 m/s2
- -3.0 m/s2
Consider the v-t graph below. What is the acceleration during the time interval from t = 0 s to t = 4 s?
- 3.0 m/s2
- 2.0 m/s2
- 1.0 m/s2
- 0.0 m/s2
- -1.0 m/s2
- -2.0 m/s2
- -3.0 m/s2
Consider the v-t graph below. What is the acceleration during the time interval from t = 0 s to t = 2 s?
- 3.0 m/s2
- 2.0 m/s2
- 1.0 m/s2
- 0.0 m/s2
- -1.0 m/s2
- -2.0 m/s2
- -3.0 m/s2
Consider the v-t graph below. What is the acceleration during the time interval from t = 0 s to t = 2 s?
- 3.0 m/s2
- 2.0 m/s2
- 1.0 m/s2
- 0.0 m/s2
- -1.0 m/s2
- -2.0 m/s2
- -3.0 m/s2
Consider the v-t graph below. What is the acceleration during the time interval from t = 0 s to t = 2 s?
- 3.0 m/s2
- 2.0 m/s2
- 1.0 m/s2
- 0.0 m/s2
- -1.0 m/s2
- -2.0 m/s2
- -3.0 m/s2
Consider the v-t graph below. What is the acceleration during the time interval from t = 0 s to t = 4 s?
- 3.0 m/s2
- 2.0 m/s2
- 1.0 m/s2
- 0.0 m/s2
- -1.0 m/s2
- -2.0 m/s2
- -3.0 m/s2
Consider the v-t graph below. What is the acceleration during the time interval from t = 0 s to t = 4 s?
- 3.0 m/s2
- 2.0 m/s2
- 1.0 m/s2
- 0.0 m/s2
- -1.0 m/s2
- -2.0 m/s2
- -3.0 m/s2
Consider the v-t graph below. What is the acceleration during the time interval from t = 0 s to t = 4 s?
- 3.0 m/s2
- 2.0 m/s2
- 1.0 m/s2
- 0.0 m/s2
- -1.0 m/s2
- -2.0 m/s2
- -3.0 m/s2
Consider the v-t graph below. What is the acceleration during the time interval from t = 0 s to t = 4 s?
- 3.0 m/s2
- 2.0 m/s2
- 1.0 m/s2
- 0.0 m/s2
- -1.0 m/s2
- -2.0 m/s2
- -3.0 m/s2
Consider the v-t graph below. What is the acceleration during the time interval from t = 0 s to t = 4 s?
- 3.0 m/s2
- 2.0 m/s2
- 1.0 m/s2
- 0.0 m/s2
- -1.0 m/s2
- -2.0 m/s2
- -3.0 m/s2
Consider the v-t graph below. What is the acceleration during the time interval from t = 0 s to t = 4 s?
- 3.0 m/s2
- 2.0 m/s2
- 1.0 m/s2
- 0.0 m/s2
- -1.0 m/s2
- -2.0 m/s2
- -3.0 m/s2
Consider the v-t graph below. What is the acceleration during the time interval from t = 2 s to t = 4 s?
- 3.0 m/s2
- 2.0 m/s2
- 1.0 m/s2
- 0.0 m/s2
- -1.0 m/s2
- -2.0 m/s2
- -3.0 m/s2
Consider the v-t graph below. What is the acceleration during the time interval from t = 2 s to t = 4 s?
- 3.0 m/s2
- 2.0 m/s2
- 1.0 m/s2
- 0.0 m/s2
- -1.0 m/s2
- -2.0 m/s2
- -3.0 m/s2
Consider the v-t graph below. What is the acceleration during the time interval from t = 2 s to t = 4 s?
- 3.0 m/s2
- 2.0 m/s2
- 1.0 m/s2
- 0.0 m/s2
- -1.0 m/s2
- -2.0 m/s2
- -3.0 m/s2
Consider the v-t graph below. What is the acceleration during the time interval from t = 2 s to t = 4 s?
- 3.0 m/s2
- 2.0 m/s2
- 1.0 m/s2
- 0.0 m/s2
- -1.0 m/s2
- -2.0 m/s2
- -3.0 m/s2
Consider the v-t graph below. What is the acceleration during the time interval from t = 2 s to t = 4 s?
- 3.0 m/s2
- 2.0 m/s2
- 1.0 m/s2
- 0.0 m/s2
- -1.0 m/s2
- -2.0 m/s2
- -3.0 m/s2
Consider the v-t graph below. What is the acceleration during the time interval from t = 2 s to t = 4 s?
- 3.0 m/s2
- 2.0 m/s2
- 1.0 m/s2
- 0.0 m/s2
- -1.0 m/s2
- -2.0 m/s2
- -3.0 m/s2
Consider the v-t graph below. What is the acceleration during the time interval from t = 2 s to t = 4 s?
- 3.0 m/s2
- 2.0 m/s2
- 1.0 m/s2
- 0.0 m/s2
- -1.0 m/s2
- -2.0 m/s2
- -3.0 m/s2
Consider the v-t graph below. What is the acceleration during the time interval from t = 2 s to t = 4 s?
- 3.0 m/s2
- 2.0 m/s2
- 1.0 m/s2
- 0.0 m/s2
- -1.0 m/s2
- -2.0 m/s2
- -3.0 m/s2
Consider the v-t graph below. What is the acceleration during the time interval from t = 4 s to t = 6 s?
- 3.0 m/s2
- 2.0 m/s2
- 1.0 m/s2
- 0.0 m/s2
- -1.0 m/s2
- -2.0 m/s2
- -3.0 m/s2
Consider the v-t graph below. What is the acceleration during the time interval from t = 4 s to t = 6 s?
- 3.0 m/s2
- 2.0 m/s2
- 1.0 m/s2
- 0.0 m/s2
- -1.0 m/s2
- -2.0 m/s2
- -3.0 m/s2
Consider the v-t graph below. What is the acceleration during the time interval from t = 2 s to t = 6 s?
- 3.0 m/s2
- 2.0 m/s2
- 1.0 m/s2
- 0.0 m/s2
- -1.0 m/s2
- -2.0 m/s2
- -3.0 m/s2
Consider the v-t graph below. What is the acceleration during the time interval from t = 2 s to t = 6 s?
- 3.0 m/s2
- 2.0 m/s2
- 1.0 m/s2
- 0.0 m/s2
- -1.0 m/s2
- -2.0 m/s2
- -3.0 m/s2
Consider the v-t graph below. What is the acceleration during the time interval from t = 2 s to t = 6 s?
- 3.0 m/s2
- 2.0 m/s2
- 1.0 m/s2
- 0.0 m/s2
- -1.0 m/s2
- -2.0 m/s2
- -3.0 m/s2
Consider the v-t graph below. What is the acceleration during the time interval from t = 2 s to t = 6 s?
- 3.0 m/s2
- 2.0 m/s2
- 1.0 m/s2
- 0.0 m/s2
- -1.0 m/s2
- -2.0 m/s2
- -3.0 m/s2
Consider the v-t graph below. What is the acceleration during the time interval from t = 2 s to t = 6 s?
- 3.0 m/s2
- 2.0 m/s2
- 1.0 m/s2
- 0.0 m/s2
- -1.0 m/s2
- -2.0 m/s2
- -3.0 m/s2
Consider the v-t graph below. What is the acceleration during the time interval from t = 2 s to t = 6 s?
- 3.0 m/s2
- 2.0 m/s2
- 1.0 m/s2
- 0.0 m/s2
- -1.0 m/s2
- -2.0 m/s2
- -3.0 m/s2
Consider the v-t graph below. What is the acceleration during the time interval from t = 2 s to t = 6 s?
- 3.0 m/s2
- 2.0 m/s2
- 1.0 m/s2
- 0.0 m/s2
- -1.0 m/s2
- -2.0 m/s2
- -3.0 m/s2
Consider the v-t graph below. What is the acceleration during the time interval from t = 2 s to t = 6 s?
- 3.0 m/s2
- 2.0 m/s2
- 1.0 m/s2
- 0.0 m/s2
- -1.0 m/s2
- -2.0 m/s2
- -3.0 m/s2
Consider the v-t graph below. What is the acceleration during the time interval from t = 2 s to t = 6 s?
- 3.0 m/s2
- 2.0 m/s2
- 1.0 m/s2
- 0.0 m/s2
- -1.0 m/s2
- -2.0 m/s2
- -3.0 m/s2
Consider the v-t graph below. What is the acceleration during the time interval from t = 2 s to t = 6 s?
- 3.0 m/s2
- 2.0 m/s2
- 1.0 m/s2
- 0.0 m/s2
- -1.0 m/s2
- -2.0 m/s2
- -3.0 m/s2
Consider the v-t graph below. What is the acceleration during the time interval from t = 2 s to t = 6 s?
- 3.0 m/s2
- 2.0 m/s2
- 1.0 m/s2
- 0.0 m/s2
- -1.0 m/s2
- -2.0 m/s2
- -3.0 m/s2
Consider the v-t graph below. What is the acceleration during the time interval from t = 2 s to t = 6 s?
- 3.0 m/s2
- 2.0 m/s2
- 1.0 m/s2
- 0.0 m/s2
- -1.0 m/s2
- -2.0 m/s2
- -3.0 m/s2
Consider the v-t graph below. What is the acceleration during the time interval from t = 4 s to t = 6 s?
- 3.0 m/s2
- 2.0 m/s2
- 1.0 m/s2
- 0.0 m/s2
- -1.0 m/s2
- -2.0 m/s2
- -3.0 m/s2
Consider the v-t graph below. What is the acceleration during the time interval from t = 4 s to t = 6 s?
- 3.0 m/s2
- 2.0 m/s2
- 1.0 m/s2
- 0.0 m/s2
- -1.0 m/s2
- -2.0 m/s2
- -3.0 m/s2
Consider the v-t graph below. What is the acceleration during the time interval from t = 4 s to t = 6 s?
- 3.0 m/s2
- 2.0 m/s2
- 1.0 m/s2
- 0.0 m/s2
- -1.0 m/s2
- -2.0 m/s2
- -3.0 m/s2
Consider the v-t graph below. What is the acceleration during the time interval from t = 2 s to t = 4 s?
- 3.0 m/s2
- 2.0 m/s2
- 1.0 m/s2
- 0.0 m/s2
- -1.0 m/s2
- -2.0 m/s2
- -3.0 m/s2
Consider the v-t graph below. What is the acceleration during the time interval from t = 2 s to t = 4 s?
- 3.0 m/s2
- 2.0 m/s2
- 1.0 m/s2
- 0.0 m/s2
- -1.0 m/s2
- -2.0 m/s2
- -3.0 m/s2
Consider the v-t graph below. What is the acceleration during the time interval from t = 2 s to t = 4 s?
- 3.0 m/s2
- 2.0 m/s2
- 1.0 m/s2
- 0.0 m/s2
- -1.0 m/s2
- -2.0 m/s2
- -3.0 m/s2
Consider the v-t graph below. What is the acceleration during the time interval from t = 4 s to t = 6 s?
- 3.0 m/s2
- 2.0 m/s2
- 1.0 m/s2
- 0.0 m/s2
- -1.0 m/s2
- -2.0 m/s2
- -3.0 m/s2
Consider the v-t graph below. What is the acceleration during the time interval from t = 4 s to t = 6 s?
- 3.0 m/s2
- 2.0 m/s2
- 1.0 m/s2
- 0.0 m/s2
- -1.0 m/s2
- -2.0 m/s2
- -3.0 m/s2
Consider the v-t graph below. What is the acceleration during the time interval from t = 4 s to t = 6 s?
- 3.0 m/s2
- 2.0 m/s2
- 1.0 m/s2
- 0.0 m/s2
- -1.0 m/s2
- -2.0 m/s2
- -3.0 m/s2
Consider the v-t graph below. What is the acceleration during the time interval from t = 4 s to t = 6 s?
- 3.0 m/s2
- 2.0 m/s2
- 1.0 m/s2
- 0.0 m/s2
- -1.0 m/s2
- -2.0 m/s2
- -3.0 m/s2
Consider the v-t graph below. What is the acceleration during the time interval from t = 4 s to t = 6 s?
- 3.0 m/s2
- 2.0 m/s2
- 1.0 m/s2
- 0.0 m/s2
- -1.0 m/s2
- -2.0 m/s2
- -3.0 m/s2
Consider the v-t graph below. What is the acceleration during the time interval from t = 4 s to t = 6 s?
- 3.0 m/s2
- 2.0 m/s2
- 1.0 m/s2
- 0.0 m/s2
- -1.0 m/s2
- -2.0 m/s2
- -3.0 m/s2
Consider the v-t graph below. What is the acceleration during the time interval from t = 4 s to t = 8 s?
- 3.0 m/s2
- 2.0 m/s2
- 1.0 m/s2
- 0.0 m/s2
- -1.0 m/s2
- -2.0 m/s2
- -3.0 m/s2
Consider the v-t graph below. What is the acceleration during the time interval from t = 4 s to t = 8 s?
- 3.0 m/s2
- 2.0 m/s2
- 1.0 m/s2
- 0.0 m/s2
- -1.0 m/s2
- -2.0 m/s2
- -3.0 m/s2
Consider the v-t graph below. What is the acceleration during the time interval from t = 4 s to t = 8 s?
- 3.0 m/s2
- 2.0 m/s2
- 1.0 m/s2
- 0.0 m/s2
- -1.0 m/s2
- -2.0 m/s2
- -3.0 m/s2
Consider the v-t graph below. What is the acceleration during the time interval from t = 4 s to t = 8 s?
- 3.0 m/s2
- 2.0 m/s2
- 1.0 m/s2
- 0.0 m/s2
- -1.0 m/s2
- -2.0 m/s2
- -3.0 m/s2
Consider the v-t graph below. What is the acceleration during the time interval from t = 4 s to t = 8 s?
- 3.0 m/s2
- 2.0 m/s2
- 1.0 m/s2
- 0.0 m/s2
- -1.0 m/s2
- -2.0 m/s2
- -3.0 m/s2
Consider the v-t graph below. What is the acceleration during the time interval from t = 4 s to t = 8 s?
- 3.0 m/s2
- 2.0 m/s2
- 1.0 m/s2
- 0.0 m/s2
- -1.0 m/s2
- -2.0 m/s2
- -3.0 m/s2
Consider the v-t graph below. What is the acceleration during the time interval from t = 4 s to t = 8 s?
- 3.0 m/s2
- 2.0 m/s2
- 1.0 m/s2
- 0.0 m/s2
- -1.0 m/s2
- -2.0 m/s2
- -3.0 m/s2
Consider the v-t graph below. What is the acceleration during the time interval from t = 4 s to t = 8 s?
- 3.0 m/s2
- 2.0 m/s2
- 1.0 m/s2
- 0.0 m/s2
- -1.0 m/s2
- -2.0 m/s2
- -3.0 m/s2
Consider the v-t graph below. What is the acceleration during the time interval from t = 6 s to t = 8 s?
- 3.0 m/s2
- 2.0 m/s2
- 1.0 m/s2
- 0.0 m/s2
- -1.0 m/s2
- -2.0 m/s2
- -3.0 m/s2
Consider the v-t graph below. What is the acceleration during the time interval from t = 6 s to t = 8 s?
- 3.0 m/s2
- 2.0 m/s2
- 1.0 m/s2
- 0.0 m/s2
- -1.0 m/s2
- -2.0 m/s2
- -3.0 m/s2
Consider the v-t graph below. What is the acceleration during the time interval from t = 6 s to t = 8 s?
- 3.0 m/s2
- 2.0 m/s2
- 1.0 m/s2
- 0.0 m/s2
- -1.0 m/s2
- -2.0 m/s2
- -3.0 m/s2
Consider the v-t graph below. What is the acceleration during the time interval from t = 6 s to t = 8 s?
- 3.0 m/s2
- 2.0 m/s2
- 1.0 m/s2
- 0.0 m/s2
- -1.0 m/s2
- -2.0 m/s2
- -3.0 m/s2
Consider the v-t graph below. What is the acceleration during the time interval from t = 6 s to t = 8 s?
- 3.0 m/s2
- 2.0 m/s2
- 1.0 m/s2
- 0.0 m/s2
- -1.0 m/s2
- -2.0 m/s2
- -3.0 m/s2
Consider the v-t graph below. What is the acceleration during the time interval from t = 6 s to t = 8 s?
- 3.0 m/s2
- 2.0 m/s2
- 1.0 m/s2
- 0.0 m/s2
- -1.0 m/s2
- -2.0 m/s2
- -3.0 m/s2
Consider the v-t graph below. What is the acceleration during the time interval from t = 6 s to t = 8 s?
- 3.0 m/s2
- 2.0 m/s2
- 1.0 m/s2
- 0.0 m/s2
- -1.0 m/s2
- -2.0 m/s2
- -3.0 m/s2
Consider the v-t graph below. What is the acceleration during the time interval from t = 6 s to t = 8 s?
- 3.0 m/s2
- 2.0 m/s2
- 1.0 m/s2
- 0.0 m/s2
- -1.0 m/s2
- -2.0 m/s2
- -3.0 m/s2
Consider the v-t graph below. What is the acceleration during the time interval from t = 6 s to t = 8 s?
- 3.0 m/s2
- 2.0 m/s2
- 1.0 m/s2
- 0.0 m/s2
- -1.0 m/s2
- -2.0 m/s2
- -3.0 m/s2
Consider the v-t graph below. What is the acceleration during the time interval from t = 6 s to t = 8 s?
- 3.0 m/s2
- 2.0 m/s2
- 1.0 m/s2
- 0.0 m/s2
- -1.0 m/s2
- -2.0 m/s2
- -3.0 m/s2
Consider the v-t graph below. What is the acceleration during the time interval from t = 6 s to t = 8 s?
- 3.0 m/s2
- 2.0 m/s2
- 1.0 m/s2
- 0.0 m/s2
- -1.0 m/s2
- -2.0 m/s2
- -3.0 m/s2
Consider the v-t graph below. What is the acceleration during the time interval from t = 6 s to t = 8 s?
- 3.0 m/s2
- 2.0 m/s2
- 1.0 m/s2
- 0.0 m/s2
- -1.0 m/s2
- -2.0 m/s2
- -3.0 m/s2
Consider the v-t graph below. What is the acceleration during the time interval from t = 6 s to t = 8 s?
- 3.0 m/s2
- 2.0 m/s2
- 1.0 m/s2
- 0.0 m/s2
- -1.0 m/s2
- -2.0 m/s2
- -3.0 m/s2
Consider the v-t graph below. What is the acceleration during the time interval from t = 6 s to t = 8 s?
- 3.0 m/s2
- 2.0 m/s2
- 1.0 m/s2
- 0.0 m/s2
- -1.0 m/s2
- -2.0 m/s2
- -3.0 m/s2
Consider the v-t graph below. What is the acceleration during the time interval from t = 6 s to t = 8 s?
- 3.0 m/s2
- 2.0 m/s2
- 1.0 m/s2
- 0.0 m/s2
- -1.0 m/s2
- -2.0 m/s2
- -3.0 m/s2
Consider the v-t graph below. What is the acceleration during the time interval from t = 6 s to t = 8 s?
- 3.0 m/s2
- 2.0 m/s2
- 1.0 m/s2
- 0.0 m/s2
- -1.0 m/s2
- -2.0 m/s2
- -3.0 m/s2
Consider the v-t graph below. What is the acceleration during the time interval from t = 6 s to t = 8 s?
- 3.0 m/s2
- 2.0 m/s2
- 1.0 m/s2
- 0.0 m/s2
- -1.0 m/s2
- -2.0 m/s2
- -3.0 m/s2
Consider the v-t graph below. What is the acceleration during the time interval from t = 4 s to t = 8 s?
- 3.0 m/s2
- 2.0 m/s2
- 1.0 m/s2
- 0.0 m/s2
- -1.0 m/s2
- -2.0 m/s2
- -3.0 m/s2
Consider the v-t graph below. What is the acceleration during the time interval from t = 4 s to t = 8 s?
- 3.0 m/s2
- 2.0 m/s2
- 1.0 m/s2
- 0.0 m/s2
- -1.0 m/s2
- -2.0 m/s2
- -3.0 m/s2
Consider the v-t graph below. What is the acceleration during the time interval from t = 4 s to t = 8 s?
- 3.0 m/s2
- 2.0 m/s2
- 1.0 m/s2
- 0.0 m/s2
- -1.0 m/s2
- -2.0 m/s2
- -3.0 m/s2
Consider the v-t graph below. What is the acceleration during the time interval from t = 6 s to t = 8 s?
- 3.0 m/s2
- 2.0 m/s2
- 1.0 m/s2
- 0.0 m/s2
- -1.0 m/s2
- -2.0 m/s2
- -3.0 m/s2
Consider the v-t graph below. What is the acceleration during the time interval from t = 6 s to t = 8 s?
- 3.0 m/s2
- 2.0 m/s2
- 1.0 m/s2
- 0.0 m/s2
- -1.0 m/s2
- -2.0 m/s2
- -3.0 m/s2
Consider the v-t graph below. What is the acceleration during the time interval from t = 6 s to t = 8 s?
- 3.0 m/s2
- 2.0 m/s2
- 1.0 m/s2
- 0.0 m/s2
- -1.0 m/s2
- -2.0 m/s2
- -3.0 m/s2
Consider the v-t graph below. What is the acceleration during the time interval from t = 6 s to t = 8 s?
- 3.0 m/s2
- 2.0 m/s2
- 1.0 m/s2
- 0.0 m/s2
- -1.0 m/s2
- -2.0 m/s2
- -3.0 m/s2
Consider the v-t graph below. What is the acceleration during the time interval from t = 6 s to t = 8 s?
- 3.0 m/s2
- 2.0 m/s2
- 1.0 m/s2
- 0.0 m/s2
- -1.0 m/s2
- -2.0 m/s2
- -3.0 m/s2
Consider the v-t graph below. What is the acceleration during the time interval from t = 6 s to t = 8 s?
- 3.0 m/s2
- 2.0 m/s2
- 1.0 m/s2
- 0.0 m/s2
- -1.0 m/s2
- -2.0 m/s2
- -3.0 m/s2