![]()
![]()
![]()
![]()
![]()
| Questions: | 1 | 2 | 3 | 4 | 5 | 6 | 7 | 8 | 9 | 10 | 11 |
The speed of a wave on a string is given by the formula  , where is the linear density given by
  .
Thus the speed is
.
Thus the speed is
 .
.
If we double the tension, v = 89.1 m/s .
If we double the mass, v = 44.5 m/s .
![[Return to Top of Page]](../../top.gif)
First recall that the formula for a wave on a string is given by
y = Asin(kx ± ωt + φ0)
Thus, by inspection, we have A = 0.030 m,  ,
,
 , and φ0 = π/3. Solving for
λ
and T yields λ = 11.4 m and T = 0.100 s.
, and φ0 = π/3. Solving for
λ
and T yields λ = 11.4 m and T = 0.100 s.
We know that frequency is given by f = 1/T = 10.0 Hz.
As well, the speed of the wave is given by v = λ/T = 114 m/s.
To find the tension in the string, we take and rewrite it as
 . For the given
values, Ftension = 260 N.
. For the given
values, Ftension = 260 N.
The rate of energy flow, or energy per unit time, or power, is given
by the formula  , where
ω
= 2πf. For the given values, P = 4.05 Watts.
, where
ω
= 2πf. For the given values, P = 4.05 Watts.
The phase constant puts the vector in the first quadrant.
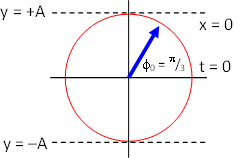
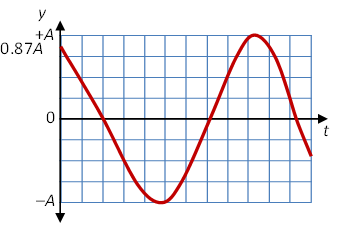
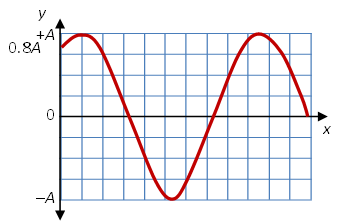
The snapshot graph, a plot of y versus x, for t = 0 can be sketched by referring to the phasor or reference circle diagram. The y-component of the amplitude is positive at x = 0, y = Asin(π/3) = 0.866A. As x increases, the phase 0.55x − 62.8t + π/3 also increases and the vector rotates counter clockwise to maximum y amplitude A. The snapshot graph therefore looks like:

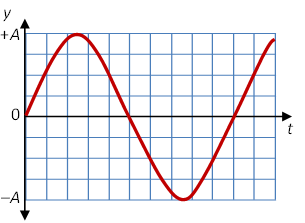
The history graph, a plot of y versus t, for x = 0 can be sketched by referring to the phasor or reference circle diagram. The y-component of the amplitude is positive at t = 0, y = Asin(π/3) = 0.866A. As t increases, the phase 0.55x − 62.8t + π/3 decreases and the vector rotates clockwise to zero amplitude. The history graph therefore looks like:
Since the peak of the harmonic wave is observed to pass every 0.050
s, T = 0.050 s. Since the distance between successive peaks is one wavelength,
λ = 0.75 m. The amplitude of a wave is given
by the height of the peak, so A = 0.025 m.
Next recall that the formula for a wave on a string is given by y = Asin(kx ± ωt + φ0). For waves moving to the left, we need the + sign. Since we start with t = 0 and x = 0 at a peak, the phase constant φ0 is π/2. So the required equation must be
y = 0.025sin(2πx/0.075 + 2πt/0.050 + π/2).
The speed of the wave is given by v = λ/T = 15.0 m/s.
From the previous question, we saw that could
be rearranged to give
could
be rearranged to give![]() .
For the given values, Ftension = 0.045 N.
.
For the given values, Ftension = 0.045 N.
The rate of energy flow, or energy per unit time, or power, is given
by the formula , where
ω
= 2πf. For the given values, P = 0.296 Watts.
, where
ω
= 2πf. For the given values, P = 0.296 Watts.
The phase constant puts the vector on the y-axis between the first and second quadrants.
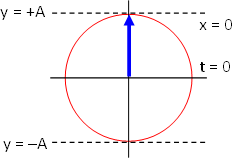
The snapshot graph, a plot of y versus x, for t = 0 can be sketched by referring to the phasor or reference circle diagram. The y-component of the amplitude is maximum, A. As x increases, the phase 8.38x + 126t + π also increases and the vector rotates counter clockwise to zero amplitude. The snapshot graph therefore looks like:

The history graph, a plot of y versus t, for x = 0 can be sketched by referring to the phasor or reference circle diagram. The y-component of the amplitude is maximum, A. As t increases, the phase 8.38x + 126t + π also increases and the vector rotates counter clockwise to zero amplitude. The history graph therefore looks like identical to the snapshot graph:

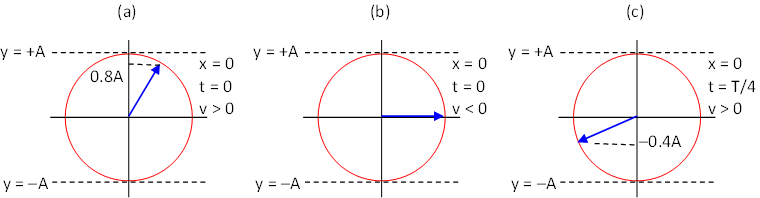
(a) The phase constant φ0 is the angle measured counter clockwise from the positive x-axis to the vector when the diagram shows x = 0 and t = 0. Simple trigonometry indicates that φ0 = arcsin(0.8) = 53.1° or 0.927 rad.
The vector in the phasor diagram rotates counter clockwise with increasing x in the y versus x, or snapshot graph. So here the y starts at 0.8A and rises to maximum amplitude A. The snapshot graph looks like.
The vector in the phasor diagram rotates clockwise with increasing t in the y versus t, or history graph if the wave is moving to the right as it does here. So here the y starts at 0.8A and falls to equilibrium, zero amplitude. The history graph looks like.

(b) The phase constant φ0 is zero.
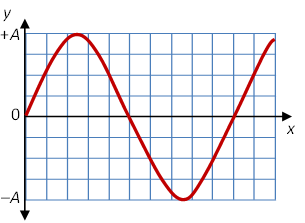
Since the wave is moving to the left, the snapshot and history graphs look identical. The vector in the phasor diagram rotates counter clockwise with increasing x or with increasing t. The initial amplitude is zero and rises to a maximum.
(c) Note that this phasor diagram is not given at t = 0 but at the later time t = T/4. The phase constant φ0 is the angle measured counter clockwise from the positive x-axis to the vector when the diagram shows the vector at x = 0 and t = 0. Since this wave is moving to the right, the vector in the phasor diagram would have already moved one-quarter of the circle clockwise in this time (T/4 &rarrow; 2π/4). We need to rotate the vector back one-quarter of the circle counter clockwise to see what it would look like at t = 0. This is shown below.
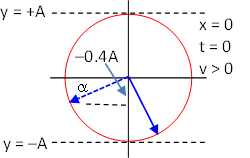
From the original information it is easy to determine the angle α = arcsin(0.4) = 23.58° = 0.412 rad. Thus the phase constant φ0 = 180° + α + 90° = 293.58° or 5.124 rad. At x = 0 and t = 0, the amplitude is y = Asin(293.58°) = −0.917A. The vector in the phasor diagram will rotate counter clockwise with increasing x in the snapshot graph heading to zero amplitude. As the wave is travelling to the right, the vector in the phasor diagram will rotate clockwise with increasing t in the history graph heading to the minimum amplitude, −A. Both graphs are shown below.
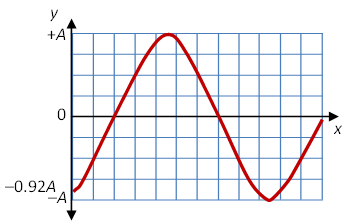
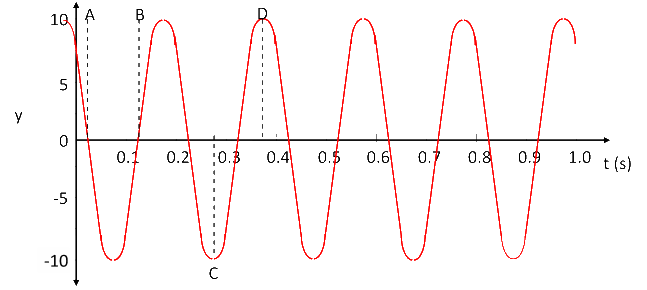
Consider the snapshot graph below for a wave moving to the right at t = 0. What is the phase constant φ0? Sketch the reference circle at the indicated points A, B, C, and D. Where exactly does point A occur? Point B?
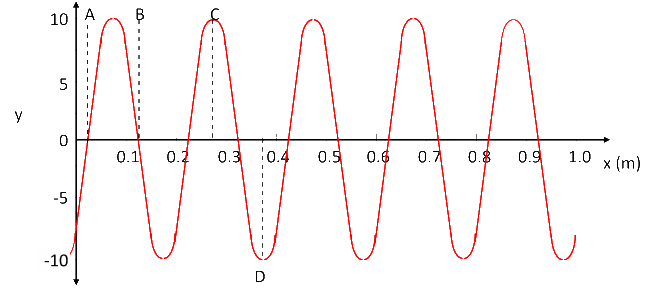
The phase constant φ0 is the angle measured counter clockwise from the positive x-axis to the vector when the phasor diagram shows x = 0 and t = 0. The snapshot graph above shows that the initial amplitude is −7.5 or −0.75A where A = 10. The graph next has zero amplitude. Since the vector in a phasor diagram moves counter clockwise with increasing x, the vector must be in the fourth quadrant as shown in the diagram below.
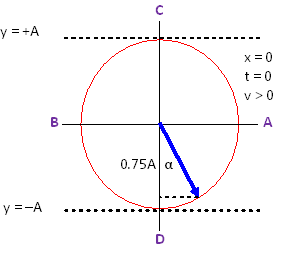
We can find the angle α in the phasor diagram, α = arccos(0.75) = 41.41° or 0.7227 rad. The phase constant is therefore φ0 = α + 270° = 311.41° = 5.435 rad.
The locations of points A, B, C, and D are shown on the phasor diagram above.
To find the exact value of x for point A, note that one full rotation of the vector about the reference circle is equivalent to a shift of one wavelength λ on the snapshot graph. The vector needs to rotate counter clockwise 90° - α = 48.59° to get to point A. Therefore the location is xA = (48.59° / 360°)λ. From the snapshot graph we can read that λ = 0.20 m. So xA = 0.0270 m.
Similarly, to find the exact value of x for point B, the vector needs to rotate counter clockwise 90° - α + 180° = 228.59°. Therefore the location is xB = (228.59° / 360°)(0.20) = 0.1270 m.
![]()
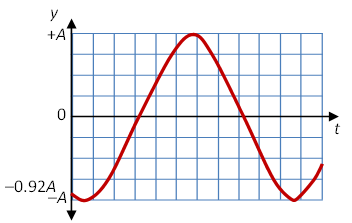
The phase constant φ0 is the angle measured counter clockwise from the positive x-axis to the vector when the phasor diagram shows x = 0 and t = 0. The history graph above shows that the initial amplitude is 7.5 or 0.75A where A = 10. The graph next has zero amplitude. Since the vector in a phasor diagram moves clockwise with increasing t for a wave travelling to the right, the vector must be in the first quadrant as shown in the diagram below.
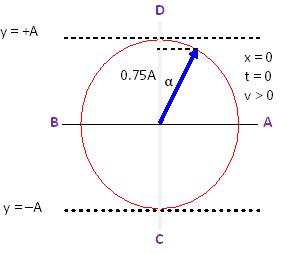
We can find the angle α in the phasor diagram, α = arccos(0.75) = 41.41° or 0.7227 rad. The phase constant is therefore φ0 = 90° − α = 48.59° = 0.8481 rad.
The locations of points A, B, C, and D are shown on the phasor diagram above.
To find the exact value of t for point A, note that one full rotation of the vector about the reference circle is equivalent to a shift of one period T on the history graph. The vector needs to rotate clockwise 48.59° to get to point A. Therefore the time is tA = (48.59° / 360°)T. From the history graph we can read that T = 0.20 s. So tA = 0.0270 s.
Similarly, to find the exact value of t for point B, the vector needs to rotate clockwise φ0 + 180° = 228.59°. Therefore the time is tB = (228.59° / 360°)(0.20) = 0.1270 s.
![]()
Superposition in 1D and 2D
We saw that when two waves on a string interfere, we get another
traveling wave whose amplitude is related to the amplitude of the original
two waves by
 .
.
This may be rearranged to yield
 .
.
Using the given values, we find
 .
.
![]()
(a) The equation for constructive interference is
The path difference Δx is d in this question and since the speakers are in phase Δφ0 = 0. The above equation can be simplified to
The smallest non-zero d for constructive intereference occurs for n = 1, so d = λ = 1.50 m.
(b) Similarly the general equation for Destructive Interference is given by
Simplifying again
The smallest non-zero d for destructive intereference occurs for m = 1, so d = ½λ = 0.75 m.
(c) Leading means the vector for the front speaker is 90° counter clockwise from the vector for the back speaker in the phasor diagram (shown below). For convenience, we can arbitrarily set the vectors at 90° and 0° in the phasor diagram. Since we draw a snapshot graph, the vectors in the phasor diagram rotate counter clockwise. The snapshot for the front speaker starts at maximum amplitude and will drop to zero. The back speaker starts at zero amplitude and rises to maximum. The diagram below shows the phasor diagram and the sound wave coming from each speaker but with the speakers shown side by side.
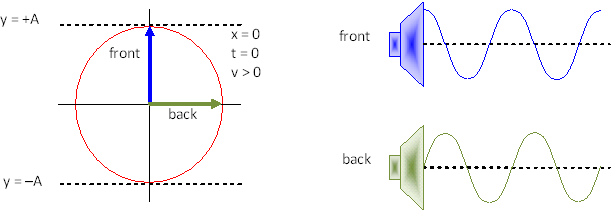
Clearly, the two waveforms will line up peak to peak, i.e. interfere constructively, when the back speaker is moved back ¼λ or d = 0.375 m.
(d) Similarly, the two waveforms will line up peak to trough, i.e. interfere destructively, when the back speaker is moved back ¾λ or d = 1.125 m.
Note in this problem, the location of the observor is irrelevant.
![]()

(a) & (b) Since the sounds are in phase, destructive interference occurs when the difference in position is an odd number of half wavelengths,
The difference in position is Δx = 21.2 m − 20.0 m = 1.2 m. We can use the relation v = λf, to eliminate λ in favour of f. Thus we get
We next need to find the smallest and largest odd values of n in the given range of frequencies of 2,000 to 20,000 Hz. We find n = 15 yields f = 2,144 Hz and n = 139 yields f = 19,865 Hz.
(c) & (d) Similarly, constructive interference occurs when the difference in position is an integral number of full wavelengths,
Using the difference in position is Δx = 1.2 m. and the relation v = λf, we get
We next need to find the smallest and largest values of n in the given range of frequencies of 2,000 to 20,000 Hz. We find n = 14 yields f = 2,001 Hz and n = 69 yields f = 19,722 Hz.
![]()
Loudest means constructive interference is occurring. There is no phase difference so the equation for superposition is
We can make this an equation for frequency rather than wavelength by using the equation v = λf to eliminate λ in the equation above.
Rearranging to isolate Δx yields
The minimum non-zero distance occurs when n = 1, and we find Δx = 1 × (343 m/s) / (750 Hz) = 0.453 m.
![]()

The speed of sound is 340 m/s. The lowest sound intensity occurs for destructive interference. If
the wall is flexible, when the sound reflects the wave will not change
phase. Thus the condition for destructive inference is
We need to use the Pythagorean Theorem to get the difference in position, Δx
= 2[(1.8 m) + (2.0 m)]½ − 4.0 m = 1.381 m. We can use the relation v
= λf, to eliminate λ
in favour of f. Thus we get
The lowest frequency is therefore 123 Hz.
Now if the wall is stiff, the phase of one wave is flipped, that is it is moved out of phase by one half wavelength. We must account for this initial difference
Or in terms of frequency
Here the n = 1 gives an unphysical solution, and the lowest frequency occurs for n = 3 and is 246 Hz.
![]()
![]()
![]()
![]()
![]()
![]()
Questions? mike.coombes@kpu.ca
![]()