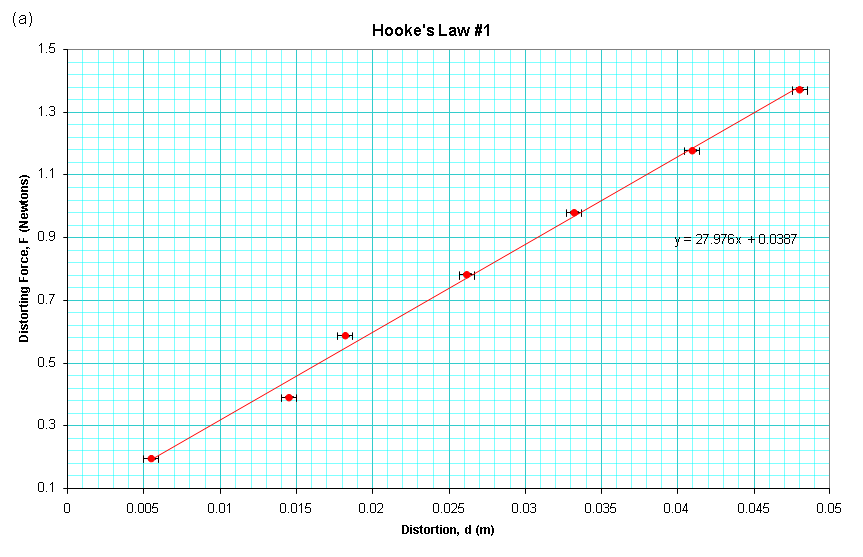
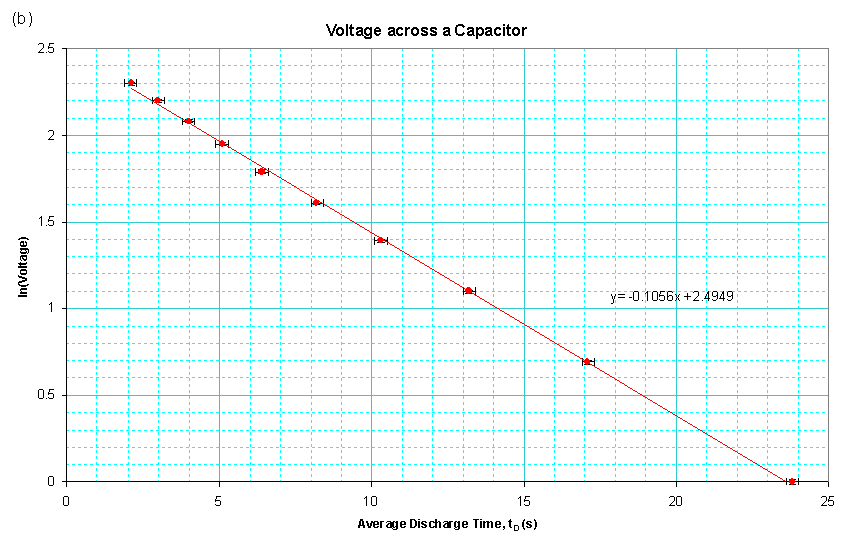
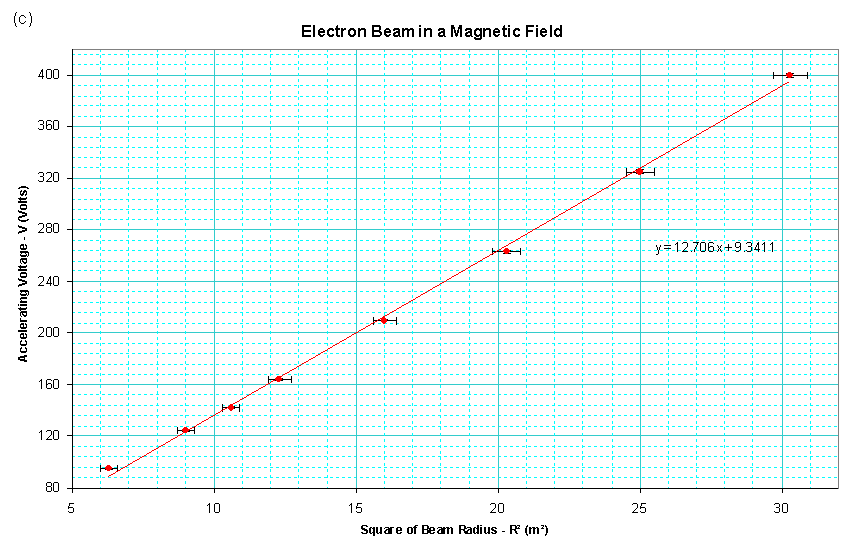
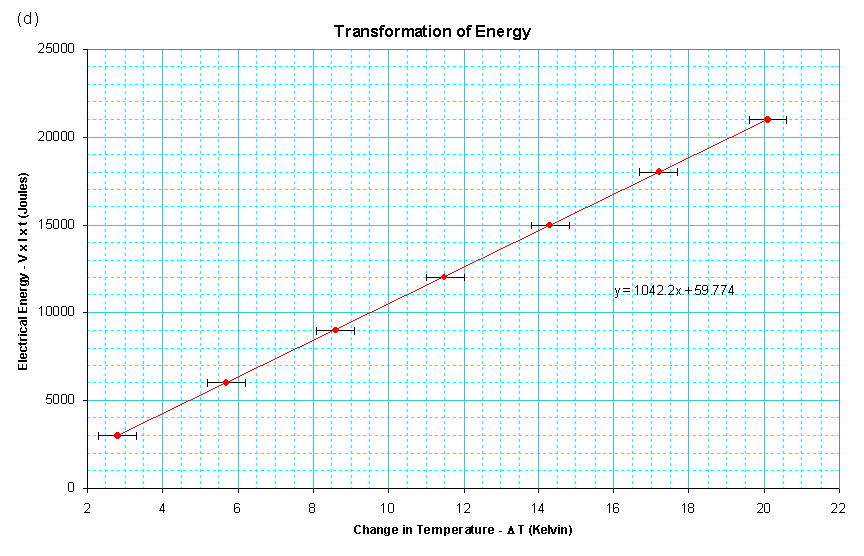
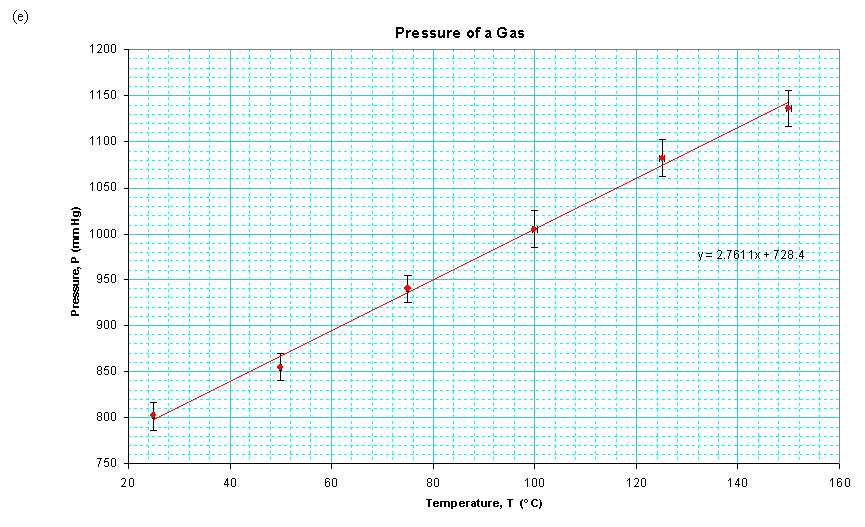
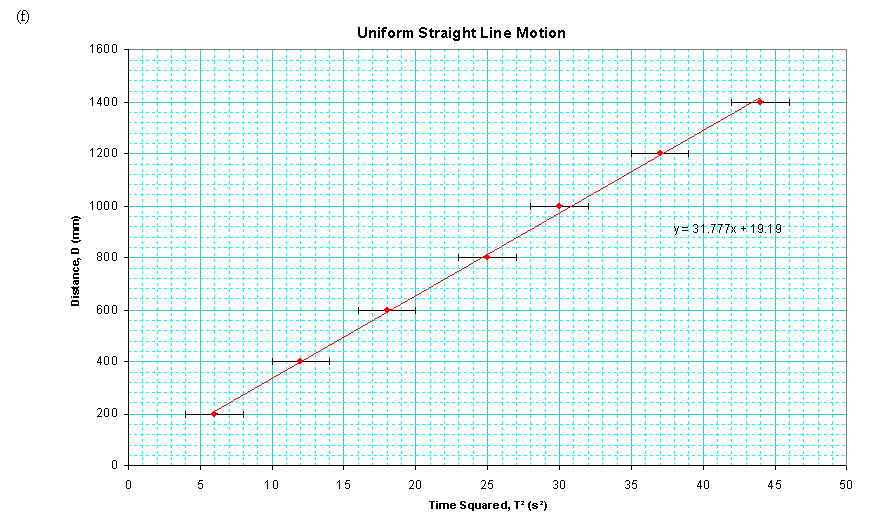
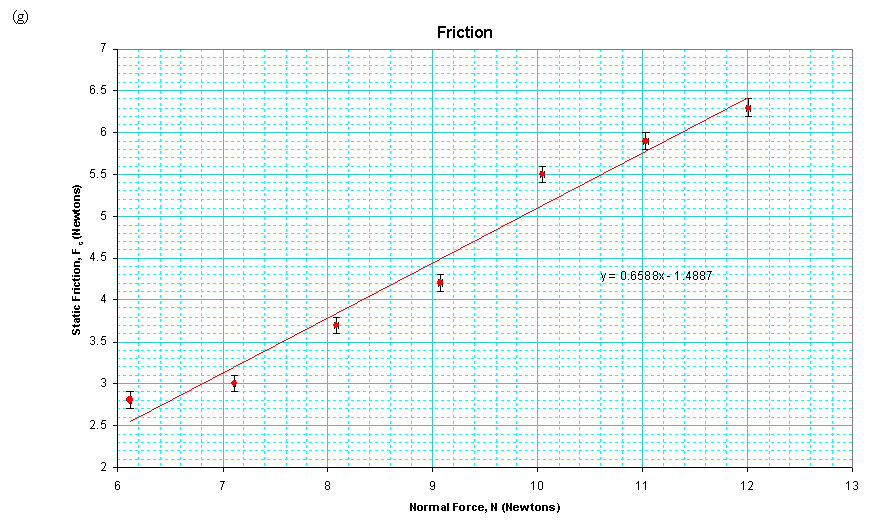
For the following graphs, write the equation of the best fit line using the correct symbols and the appropriate units and significant figures. The data on the slope and intercept is underneath the graph.